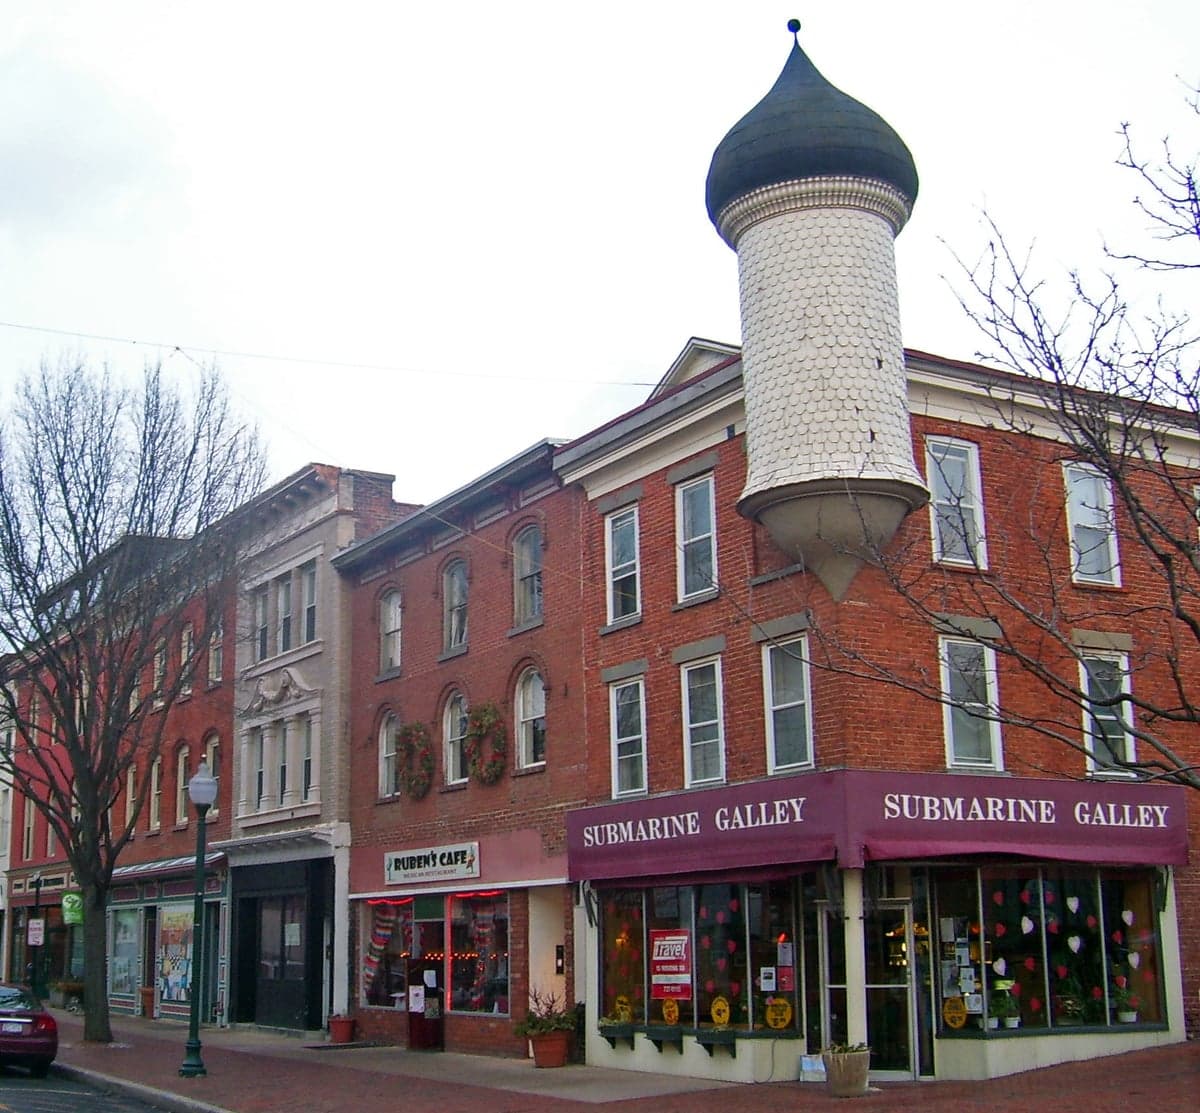
Photo: Wikipedia
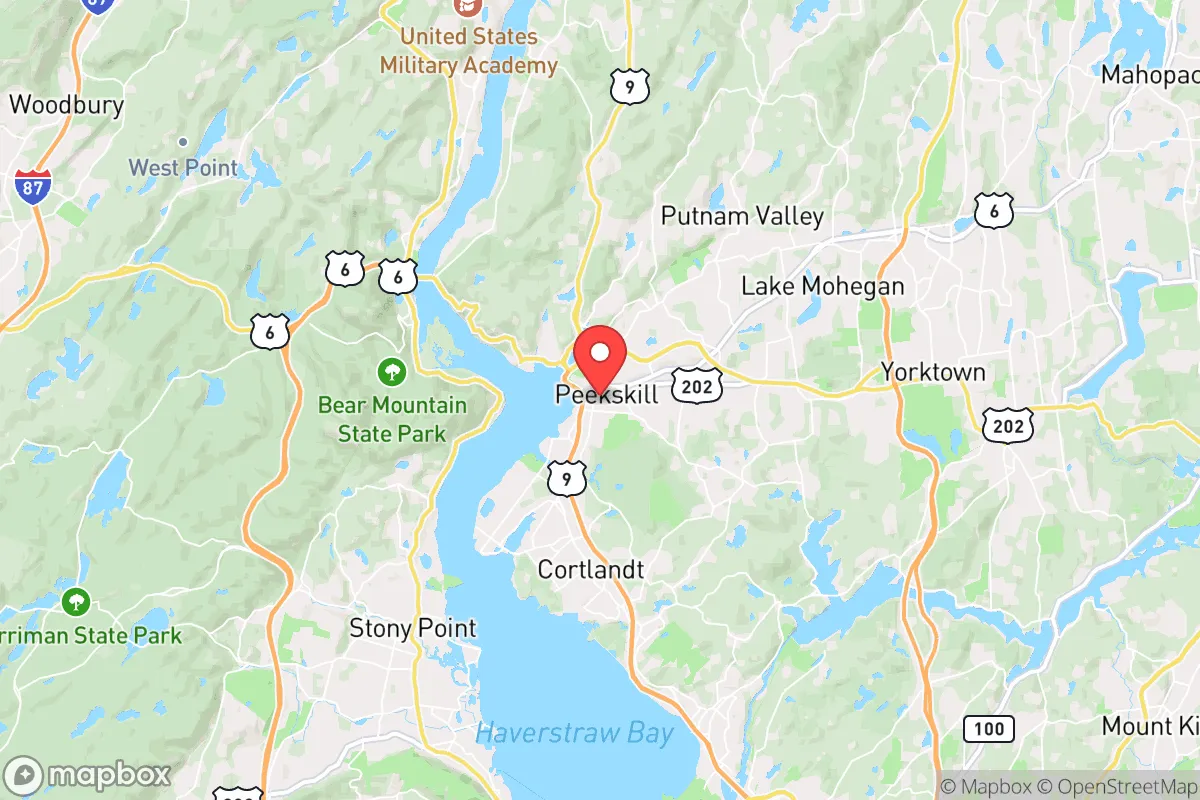
Quality of Life in Peekskill, NY
A high quality of life with strong walkability, manageable living costs, healthy neighborhood signals, and solid amenity access.
What does Quality of Life tell us?
Quality of Life blends cost of living, nearby amenities, socioeconomic signals, and neighborhood character. City-level scores represent the whole municipality; individual neighborhoods can differ.
What does this tell us?
Quality of Life blends cost of living, nearby amenities, socioeconomic signals, and neighborhood character. City-level scores represent the whole municipality; individual neighborhoods can differ.
Cost of Living
51% above national average
The Real Cost of Living in Peekskill, NY for 2026
| Tier | Individual | Family (4) |
|---|---|---|
| Survival | $30k | $57k |
| Comfortable | $73k | $108k |
| Luxury | $152k+ | $235k+ |
| Elite (Top 5%) | $179k+ | $277k+ |
85%
The Area Signal
A metric tracking the socioeconomic signals of the area.
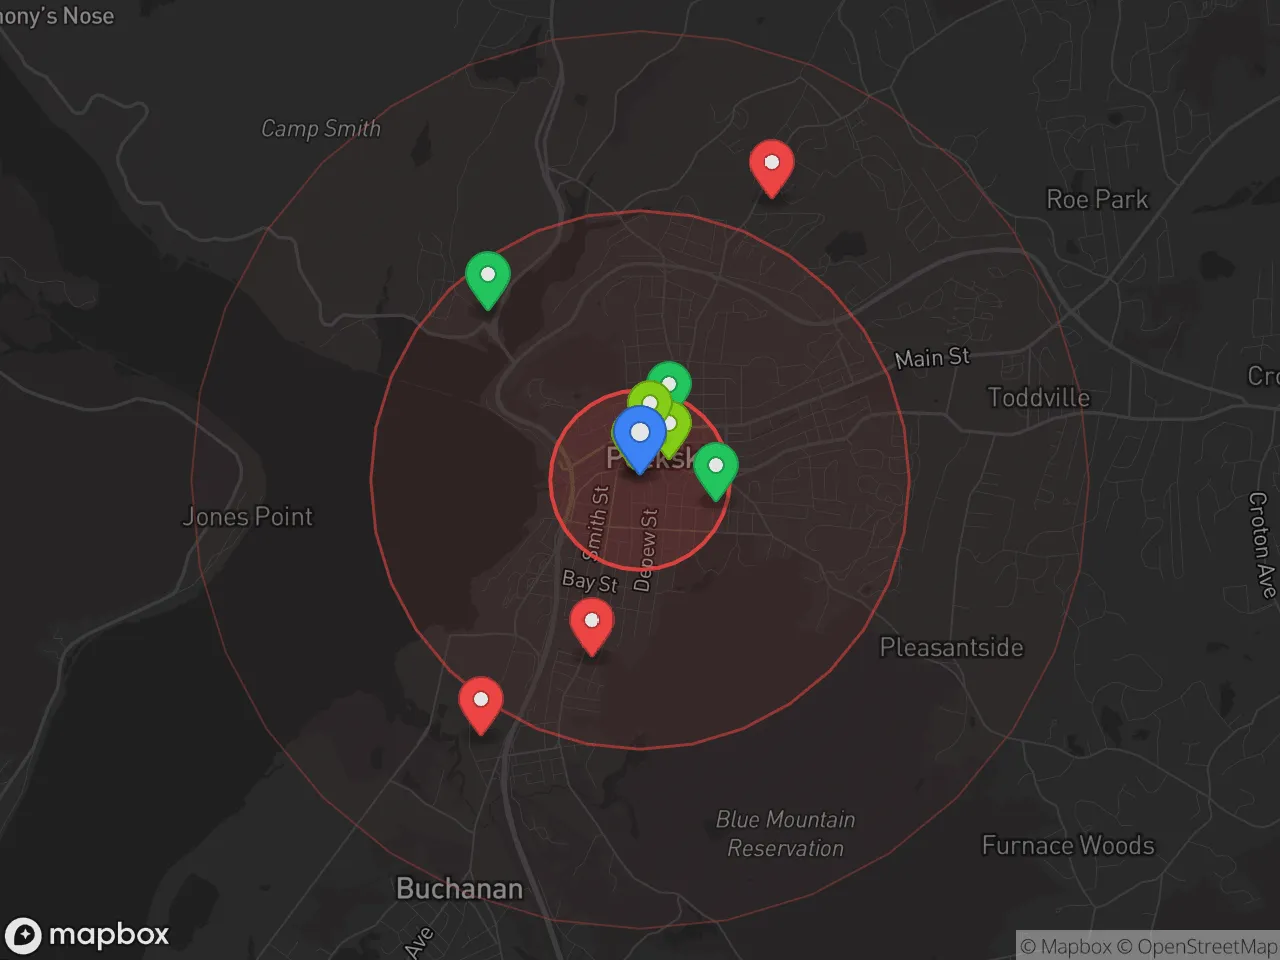
Hobbies
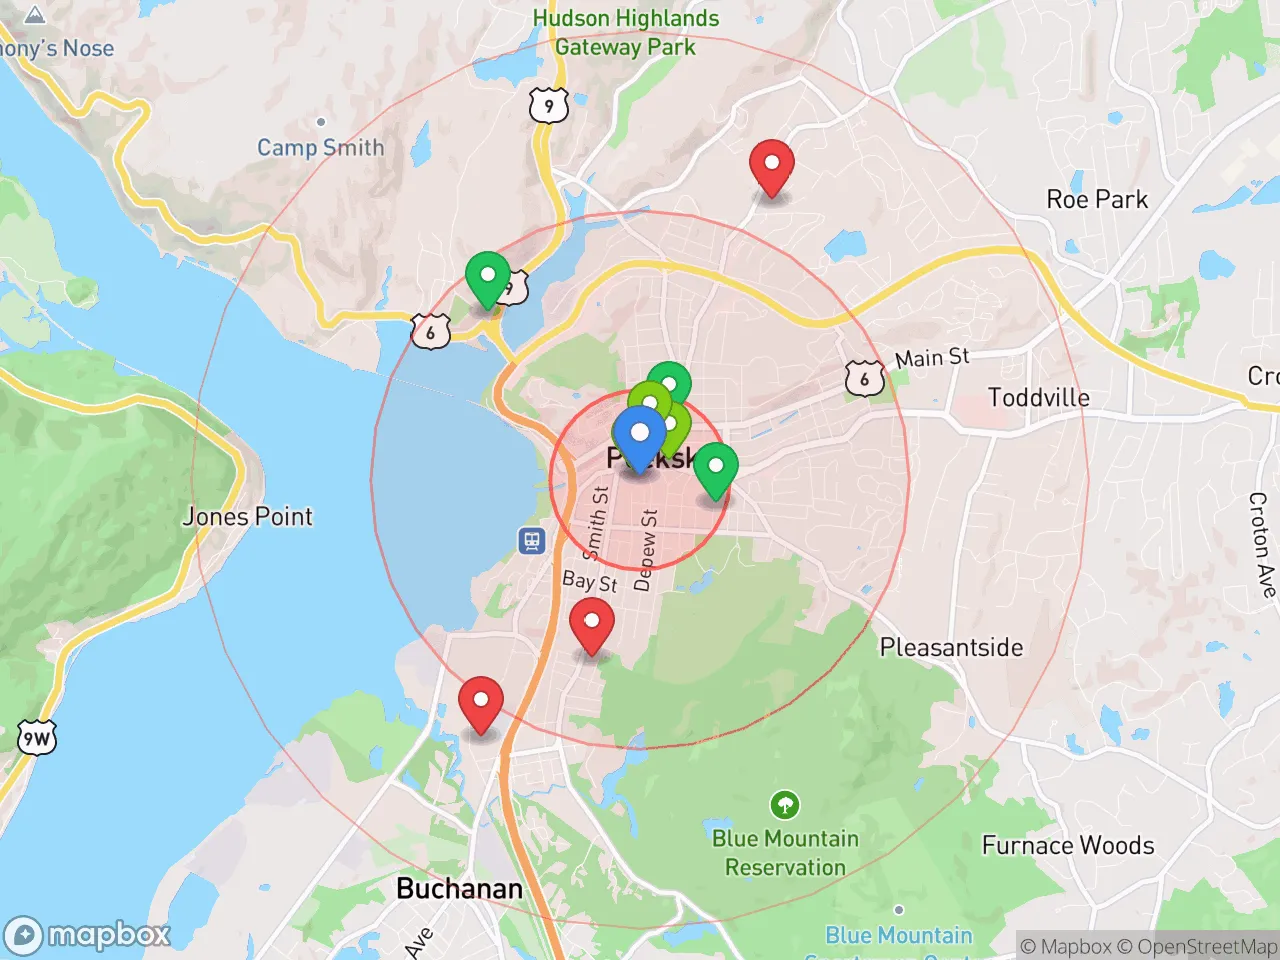
Explore the areaGroceries
6 within 10 miles
Gas
20 within 10 miles
Hospital
20 within 20 miles
Airport
EWR — Newark Liberty International
Post Office
USPS — Peekskill, NY
Critical Amenities
Quality-of-Life Analysis
Peekskill, New York, presents a distinctive quality-of-life profile as a Hudson Valley city where a growing creative class and commuter workforce coexist with a historically working-class, diverse population. With a cost-of-living index of 151 (51% above the national average), Peekskill is more affordable than many Westchester County neighbors but still carries a significant premium over national norms, attracting a mix of artists, young professionals, and families seeking riverfront culture without Manhattan prices.
How housing costs and affordability compare to nearby Westchester towns
Peekskill’s housing market offers a relative bargain within Westchester County. The median home value sits at $376,800, notably lower than the county median of roughly $650,000 and far below commuter hubs like Scarsdale or White Plains. Median rent is $1,895, which undercuts nearby Croton-on-Hudson (around $2,200) and Ossining (around $2,000). However, the overall cost-of-living index of 151 means everyday expenses—groceries, utilities, and transportation—run about 50% above the U.S. average. Property taxes in Peekskill are high, typical for Westchester, with effective rates near 2.5% of assessed value. For renters, the market is tight: vacancy rates hover around 3-4%, and many units are older stock in walkable downtown buildings. Compared to Beacon across the river, Peekskill offers slightly lower home prices but comparable rents, making it a pragmatic choice for those who want Hudson Valley access with a shorter commute to New York City.
What daily life is like for families, commuters, and creatives
Daily life in Peekskill revolves around its compact downtown, the Hudson River waterfront, and a robust calendar of arts events. The Paramount Hudson Valley theater and the Peekskill Coffee House anchor a walkable Main Street with independent shops, breweries, and restaurants. The average commute to Manhattan is 39.8 minutes via Metro-North’s Hudson Line, with express trains reaching Grand Central in about 50 minutes—a competitive time for Westchester. Schools in the Peekskill City School District serve roughly 3,500 students, with a graduation rate near 85% and a strong English as a New Language program reflecting the city’s 40% Hispanic population. For families, the city offers several parks, including Depew Park and the Riverfront Green, plus the Blue Mountain Reservation for hiking. The creative community is visible: the annual Peekskill Film Festival and open studio events draw visitors, and the city has a growing number of galleries and music venues. Grocery access is adequate with a ShopRite and multiple bodegas, though residents often drive to Cortlandt for big-box shopping.
Peekskill is best suited for those who value cultural vibrancy and a walkable downtown over suburban sprawl, and who can absorb the high cost of living in exchange for a relatively short commute and riverfront lifestyle. Artists and remote workers will appreciate the lower housing costs compared to Beacon or Hudson, while families should weigh the school district’s challenges against the city’s diversity and community programs. Commuters who can tolerate the Metro-North schedule will find Peekskill a pragmatic alternative to pricier Westchester towns, provided they budget for the elevated cost of living and property taxes.
Crime in Peekskill, NY
Lower crime rates than 79% of comparable U.S. locations.
Violent CrimeViolent Crime Analysis
Property CrimeProperty Crime Analysis
Crime Analysis
Peekskill, New York, presents a mixed safety profile for prospective residents. The city’s violent crime rate of 224.2 incidents per 100,000 people is notably lower than the national average, but its property crime rate of 564.5 per 100,000 exceeds both state and national benchmarks. This combination places Peekskill in a category where residents generally feel safe from violent confrontation but face elevated risks of theft, burglary, and vehicle-related crime, a pattern common in many Hudson Valley communities with close proximity to New York City.
Crime in context
Compared to New York State’s overall violent crime rate of roughly 380 per 100,000, Peekskill’s figure of 224.2 per 100,000 is significantly lower, placing it in a safer tier than many upstate urban centers. However, the property crime rate of 564.5 per 100,000 sits above the state average of approximately 450 per 100,000 and well above the national median. This disparity is partly attributable to Peekskill’s location as a transit-accessible suburb of New York City, which can attract property crime from transient populations. A critical factor for readers to weigh is the influence of progressive prosecutorial policies in Westchester County. The county’s district attorney and local judges have adopted reforms emphasizing diversion and reduced incarceration for non-violent offenses. While intended to reduce recidivism, these policies have been criticized for creating a revolving-door effect, where repeat property offenders cycle through the system quickly, undermining deterrence and increasing the likelihood of victimization for residents.
What residents experience
Day-to-day life in Peekskill involves a tangible awareness of property crime. Residents commonly report package theft from porches, car break-ins, and occasional burglaries of unoccupied homes, particularly in areas near the Metro-North train station and downtown corridors. Violent crime, by contrast, is less frequent and tends to be concentrated in specific social contexts rather than random attacks on the public. The city’s police department maintains a visible presence, but the effectiveness of enforcement is constrained by the broader judicial environment. Westchester County’s bail reform and progressive charging policies mean that many property crime arrests do not result in sustained detention, a fact that frustrates community safety efforts and can lead to a perception that the justice system prioritizes offender rehabilitation over public protection.
Neighborhood-level variation
Safety in Peekskill is not uniform. The more affluent, hilltop neighborhoods west of the downtown area—such as the area around Peekskill High School and the historic district near Depew Park—experience lower crime rates, with residents reporting fewer incidents of theft and vandalism. In contrast, the downtown core, the area around the train station, and the eastern sections near the Hudson River waterfront see higher concentrations of property crime and occasional disorder. Prospective renters and homebuyers should prioritize properties with off-street parking, secure entry systems, and neighborhood watch participation, as these factors materially reduce risk. Overall, Peekskill offers a livable environment for those who take proactive security measures, but the city’s crime dynamics are shaped by both its urban-suburban character and the progressive legal framework that governs Westchester County.
* Values derived from national, state, county, city and local statistics and may differ in a specific area. Last updated: 2026-05-01T04:31:12.000Z
Narrative content on this page is AI-generated and may contain mistakes. Verify any details that matter before acting on them.
ReloMaps may earn a commission from affiliate links at no extra cost to you.