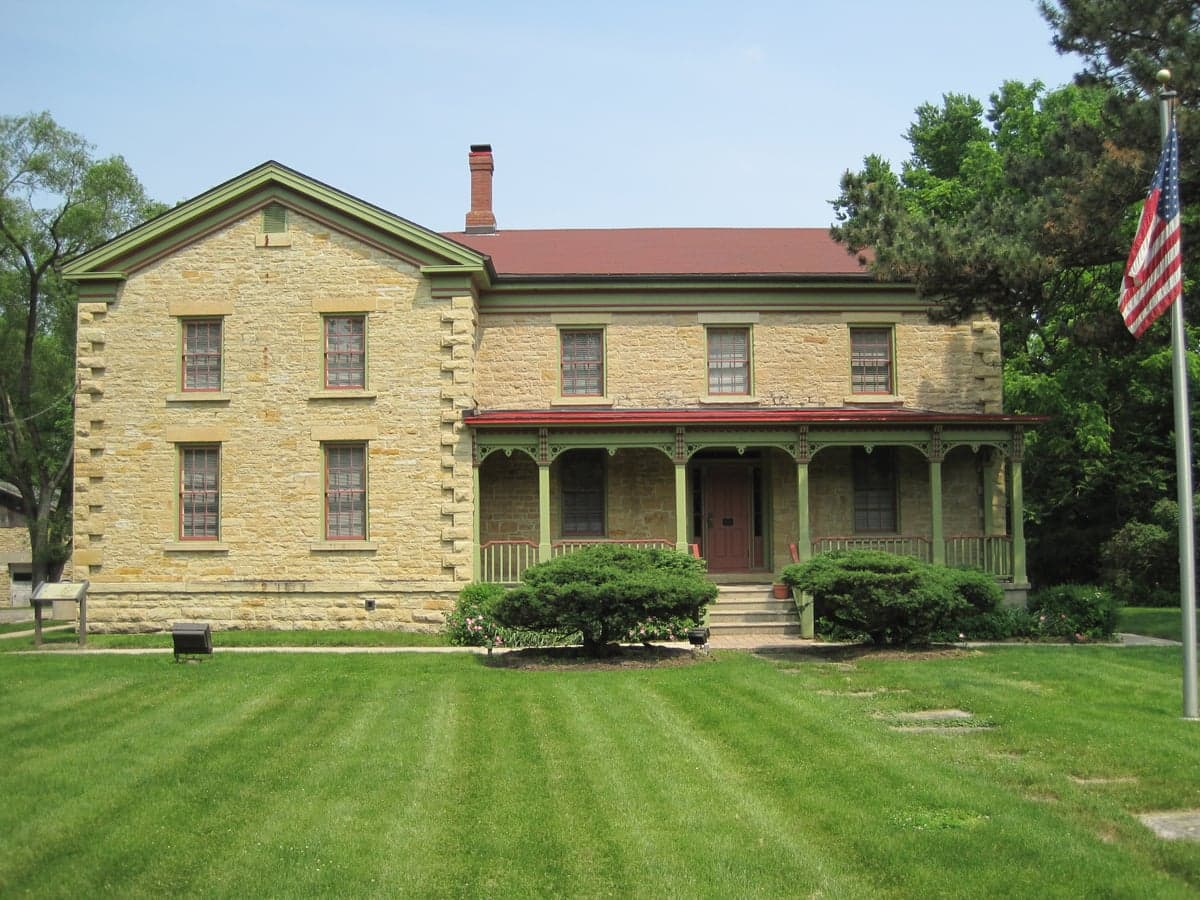
Photo: Wikipedia
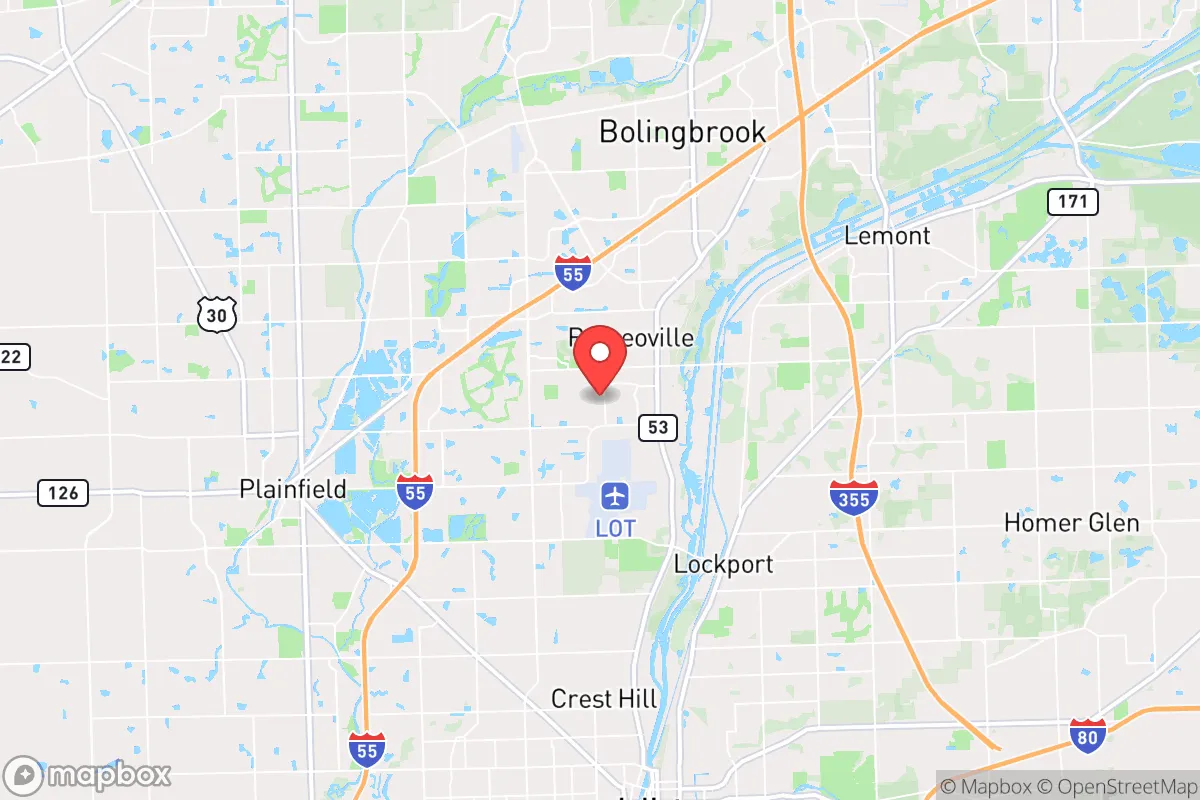
Demographics of Romeoville, IL
Affluence Level in Romeoville, IL
A middle-class area roughly in line with national averages across income, home values, education, and employment.
People of Romeoville, IL
Romeoville, Illinois, is a diverse, middle-class suburb of 40,996 residents where no single ethnic group holds a majority. The city is characterized by a significant Hispanic plurality (35.7%), a substantial White population (42.7%), and growing Black (12.5%) and East/Southeast Asian (4.6%) communities, with a foreign-born share of 8.7%. Its identity is shaped by a mix of postwar suburban development, industrial employment, and recent immigrant settlement, making it a more affordable and ethnically varied alternative to nearby Naperville or Bolingbrook.
How the city was settled and grew
Romeoville’s population history begins not with colonial settlement but with a planned industrial and residential development in the mid-20th century. The area was originally farmland, part of the larger DuPage Township, and remained sparsely populated until after World War II. The city’s modern founding dates to the 1950s, when developers began building subdivisions to house workers for the growing industrial corridor along the Des Plaines River and the nearby Argonne National Laboratory. The earliest neighborhoods, such as Lily Cache and the area around Romeo Road, were built for a predominantly White, middle-class workforce employed in manufacturing and at the Joliet Arsenal. The city was officially incorporated in 1960, with a population of just a few thousand. Through the 1960s and 1970s, growth was steady but modest, driven by the expansion of Lewis University and the construction of Interstate 55, which connected Romeoville to Chicago and Joliet. The historic core around Airport Road and the original downtown area near the DuPage River remained small-scale, with most new development occurring in planned subdivisions like Hampton Hills and Pheasant Ridge.
Modern era (post-1965)
The post-1965 immigration reforms and the broader suburbanization of the Chicago region reshaped Romeoville’s population. The 1980s and 1990s saw the first significant influx of Hispanic families, primarily of Mexican and Puerto Rican origin, drawn by affordable housing and jobs in warehousing, logistics, and light manufacturing. These families concentrated in the Lily Cache and Romeo Road corridors, where older, more affordable single-family homes and duplexes were available. By the 2000 census, the Hispanic share had risen to over 20%. The 1990s also brought a wave of Black families moving from Chicago’s South Side and southern Cook County, settling in newer subdivisions like Hampton Hills and the area around Taylor Road. The 2000s and 2010s saw the arrival of East/Southeast Asian communities—primarily Vietnamese, Filipino, and Chinese—who clustered in the Pheasant Ridge and Hampton Hills neighborhoods, drawn by the reputation of Valley View School District and proximity to Asian-owned businesses in Bolingbrook and Naperville. The Indian subcontinent population (1.4%) is smaller and more dispersed, with no single concentrated enclave. Today, Romeoville’s neighborhoods are largely integrated but show subtle clustering: Hispanic families are more prevalent in the older, western sections near Lily Cache and Romeo Road, while Black and Asian families are more common in the newer, eastern subdivisions near Weber Road and Taylor Road.
The future
Romeoville’s population is trending toward greater diversity and a slow decline in the White share, which has dropped from over 70% in 1990 to 42.7% today. The Hispanic population is the fastest-growing group, projected to approach or exceed 40% within the next decade, driven by both domestic births and continued immigration from Mexico and Central America. The Black and East/Southeast Asian shares are likely to plateau or grow modestly, as housing prices in Romeoville remain lower than in neighboring Naperville or Downers Grove, attracting families priced out of those markets. The Indian subcontinent population is expected to remain small, as most Indian families in the region prefer higher-cost suburbs with stronger professional job bases. The city is not homogenizing into a single ethnic bloc; rather, it is becoming a patchwork of distinct but integrated enclaves. The older neighborhoods near Lily Cache and Romeo Road are becoming predominantly Hispanic, while the newer subdivisions east of Weber Road are more mixed, with White, Black, and Asian families. The foreign-born share (8.7%) is moderate and likely to rise slowly, as Romeoville lacks the high-skill job base that attracts large numbers of new immigrants to Naperville or Schaumburg.
For a conservative-leaning individual or family considering a move, Romeoville offers a stable, affordable, and increasingly diverse community with a strong sense of local identity. The city is becoming a working- and middle-class hub where no single group dominates, and where the schools, parks, and public safety record remain solid. The next 10-20 years will likely see continued Hispanic growth, a stable Black and Asian presence, and a gradual decline in the White share, but without the rapid demographic upheaval seen in some Chicago suburbs. Romeoville is a place where a newcomer can find a neighborhood that fits their budget and lifestyle, whether in the older, more established sections or the newer subdivisions, and where the population is settling into a stable, multiethnic equilibrium rather than fragmenting into isolated enclaves.
* Values derived from national, state, county, city and local statistics and may differ in a specific area. Last updated: 2026-04-30T02:37:14.000Z
Narrative content on this page is AI-generated and may contain mistakes. Verify any details that matter before acting on them.
ReloMaps may earn a commission from affiliate links at no extra cost to you.