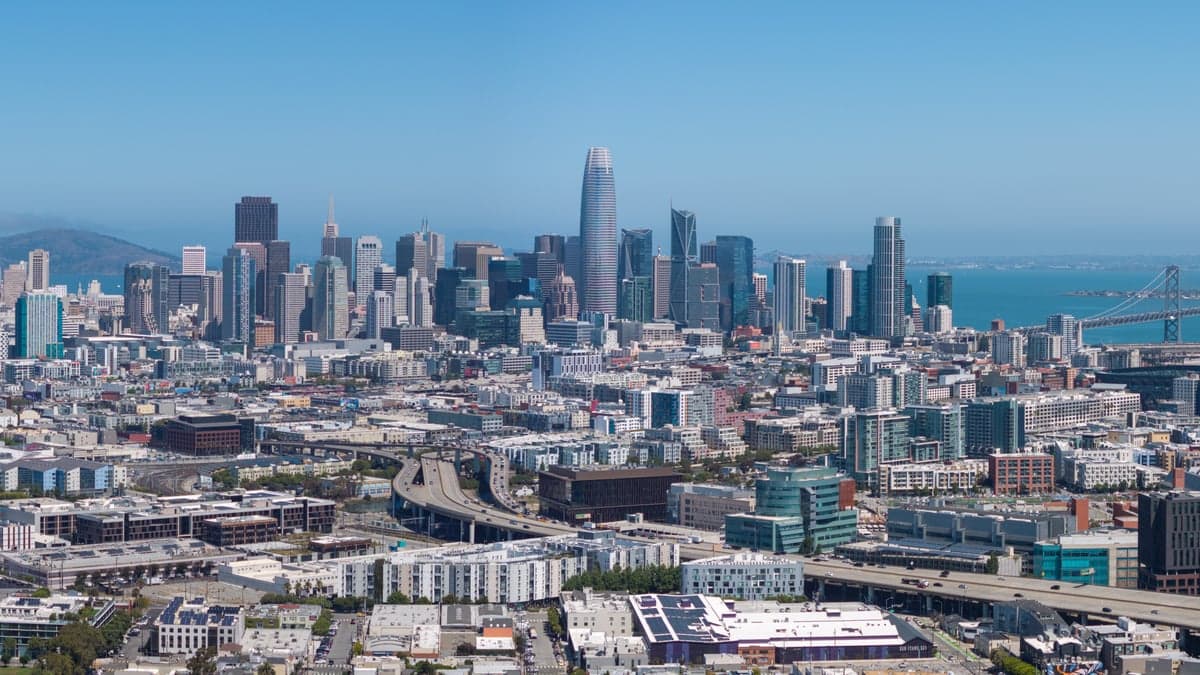
Photo: Wikipedia
Quality of Life in San Francisco, CA
Above-average quality of iife. The area offers a reasonable cost of living, decent mobility, and a mix of neighborhood amenities.
What does Quality of Life tell us?
Quality of Life blends cost of living, nearby amenities, socioeconomic signals, and neighborhood character. City-level scores represent the whole municipality; individual neighborhoods can differ.
What does this tell us?
Quality of Life blends cost of living, nearby amenities, socioeconomic signals, and neighborhood character. City-level scores represent the whole municipality; individual neighborhoods can differ.
Cost of Living
221% above national average
The Real Cost of Living in San Francisco, CA for 2026
| Tier | Individual | Family (4) |
|---|---|---|
| Survival | $39k | $73k |
| Comfortable | $207k | $304k |
| Luxury | $256k+ | $396k+ |
| Elite (Top 5%) | $357k+ | $553k+ |
47%
The Area Signal
A metric tracking the socioeconomic signals of the area.


Hobbies
Explore the areaGroceries
4 within 10 miles
Gas
0 within 10 miles
Hospital
3 within 20 miles
Airport
SFO — San Francisco International
Post Office
USPS — San Francisco, CA
Critical Amenities
Quality-of-Life Analysis
San Francisco is one of the most affluent and densely populated major cities in the United States, with a cost of living index of 321—more than three times the national average. The city attracts a highly educated, career-driven population, heavily concentrated in technology, finance, and professional services, alongside a significant creative and academic community anchored by institutions like UC San Francisco and Stanford University (just 30 miles south). This demographic mix creates a dynamic, fast-paced urban environment where high incomes coexist with extreme housing scarcity, shaping a quality of life that is both exhilarating and financially demanding.
Cost of living, housing affordability, and how San Francisco compares to the Bay Area
San Francisco’s cost of living is the highest in the continental U.S., driven almost entirely by housing. The median home value sits at $1,380,500, while the median rent is $2,419—though market-rate one-bedroom apartments in central neighborhoods like SoMa or the Mission often exceed $3,500. Compared to nearby cities, San Francisco is roughly 15-20% more expensive than Oakland and 10-15% pricier than San Jose, though it remains slightly less expensive than the ultra-wealthy enclaves of Palo Alto or Atherton on the Peninsula. The average commute of 31.2 minutes is longer than the national average (26.4 minutes), reflecting the region’s notorious traffic and reliance on BART, Muni, and Caltrain for regional travel. For renters, the city’s rent control laws (covering units built before 1979) provide some stability, but for buyers, the price-to-income ratio is among the nation’s steepest, making homeownership inaccessible to all but the top 10% of earners.
Daily life, public amenities, and what it’s like to live in San Francisco
Daily life in San Francisco is defined by its walkable, transit-connected neighborhoods—each with a distinct character, from the Victorian rowhouses of Noe Valley to the bustling commercial corridors of the Castro and the fog-shrouded parks of the Richmond. The city offers world-class amenities: Golden Gate Park (1,017 acres) hosts museums, gardens, and free concerts; the San Francisco Unified School District operates over 130 schools, though many families opt for private or charter options due to uneven public school performance. The food scene is globally renowned, with more Michelin-starred restaurants per capita than any U.S. city except New York. Outdoor access is exceptional—within a 30-minute drive, residents can hike in the Marin Headlands, surf at Ocean Beach, or bike across the Golden Gate Bridge. However, the rhythm of daily life is also shaped by visible challenges: homelessness, property crime, and the city’s famously microclimates (summer fog and winter chill) are persistent realities. The city’s 311 service and neighborhood associations provide responsive local governance, but quality-of-life issues like street cleanliness and public safety vary sharply by block.
San Francisco is best suited for professionals who can command a high salary—typically $150,000 or more for a single person—and who value urban density, cultural diversity, and progressive politics over space, car ownership, or suburban tranquility. It is a city for those who thrive on constant activity, tolerate high costs for unparalleled career opportunities, and accept trade-offs like small apartments and occasional street disorder as part of the bargain. Families with children often find the suburbs of the East Bay or Peninsula more affordable and school-friendly, while empty-nesters and young professionals remain the city’s core demographic. For the right person, San Francisco offers a quality of life unmatched in its combination of natural beauty, intellectual energy, and global connectivity—but only if the financial and lifestyle trade-offs are fully understood.
Crime in San Francisco, CA
WARNING: The crime statistics are unreliable for this jurisdiction. Local authorities have either not reported or under reported their data to the FBI. This could be due to bad intentions, incompetence or technical issues. Regardless, we suggest skepticism.
Higher crime rates than 65% of comparable U.S. locations.
Violent CrimeViolent Crime Analysis
Property CrimeProperty Crime Analysis
Crime Analysis
San Francisco’s overall safety picture is defined by a stark contrast: its violent crime rate is near the national average, but its property crime rate is among the highest in the country, creating a persistent concern for residents and visitors. The city reported a violent crime rate of 328.5 incidents per 100,000 people and a property crime rate of 1,394.1 per 100,000 in recent data. While the violent crime figure is comparable to other large U.S. metros, the property crime rate is roughly double the national average, making theft, car break-ins, and burglary the most pressing day-to-day safety issues.
Crime in context
When compared to state and national benchmarks, San Francisco’s violent crime rate sits slightly below the California average of roughly 440 per 100,000 and near the U.S. average of about 380 per 100,000. However, its property crime rate far exceeds both the California average (approximately 2,200 per 100,000) and the national average (around 1,900 per 100,000), though it has declined from pandemic-era peaks. A key factor driving these elevated property crime numbers is the city’s progressive prosecutorial policies. San Francisco’s elected district attorney and many local judges have championed reforms that prioritize diversion programs, reduced cash bail, and lighter sentencing for non-violent offenses. Critics argue this approach, while intended to reduce incarceration, has directly contributed to a cycle of repeat property offenders being released quickly, undermining deterrence and public confidence in the justice system.
What residents experience
For those living in San Francisco, the most tangible safety concern is property crime. Auto break-ins are endemic, particularly in tourist-heavy areas like Fisherman’s Wharf, Union Square, and near Golden Gate Park. Residents in neighborhoods such as the Mission, SoMa, and the Tenderloin report frequent incidents of package theft, bicycle theft, and smashed car windows. Violent crime is more concentrated, with the Tenderloin and parts of Bayview-Hunters Point experiencing higher rates of robbery and assault. Many residents adapt by never leaving valuables in cars, using secured parking, and installing home security systems. The perception of lawlessness is amplified by visible drug use and open-air drug markets, particularly along Market Street and in the Tenderloin, which the city has struggled to address despite repeated enforcement efforts.
Neighborhood-level variation
Safety varies dramatically by neighborhood. The Marina, Pacific Heights, and Noe Valley consistently report very low violent crime and moderate property crime, while the Tenderloin, SoMa, and parts of the Mission have significantly higher rates of both. Property crime is more evenly distributed, but areas with high foot traffic and tourist density—such as downtown, the Embarcadero, and Haight-Ashbury—see the most theft. For those considering a move, choosing a neighborhood with lower crime statistics and a strong community presence is critical, as the city’s overall data masks these sharp local disparities.
* Values derived from national, state, county, city and local statistics and may differ in a specific area. Last updated: 2026-04-15T23:41:27.000Z
Narrative content on this page is AI-generated and may contain mistakes. Verify any details that matter before acting on them.
ReloMaps may earn a commission from affiliate links at no extra cost to you.