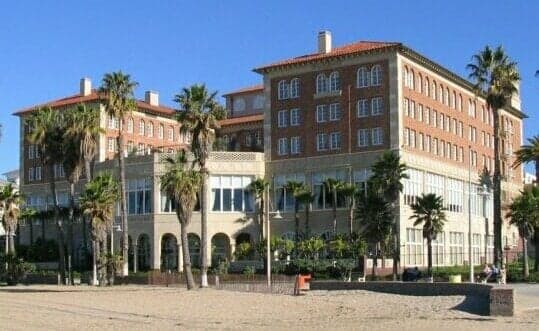
Photo: Wikipedia
Quality of Life in Santa Monica, CA
A high quality of life with strong walkability, manageable living costs, healthy neighborhood signals, and solid amenity access.
What does Quality of Life tell us?
Quality of Life blends cost of living, nearby amenities, socioeconomic signals, and neighborhood character. City-level scores represent the whole municipality; individual neighborhoods can differ.
What does this tell us?
Quality of Life blends cost of living, nearby amenities, socioeconomic signals, and neighborhood character. City-level scores represent the whole municipality; individual neighborhoods can differ.
Cost of Living
277% above national average
The Real Cost of Living in Santa Monica, CA for 2026
| Tier | Individual | Family (4) |
|---|---|---|
| Survival | $37k | $70k |
| Comfortable | $189k | $278k |
| Luxury | $198k+ | $307k+ |
| Elite (Top 5%) | $326k+ | $505k+ |
39%
The Area Signal
A metric tracking the socioeconomic signals of the area.
Hobbies
Explore the areaGroceries
0 within 10 miles
Gas
0 within 10 miles
Hospital
0 within 20 miles
Airport
LAX — Los Angeles International
Post Office
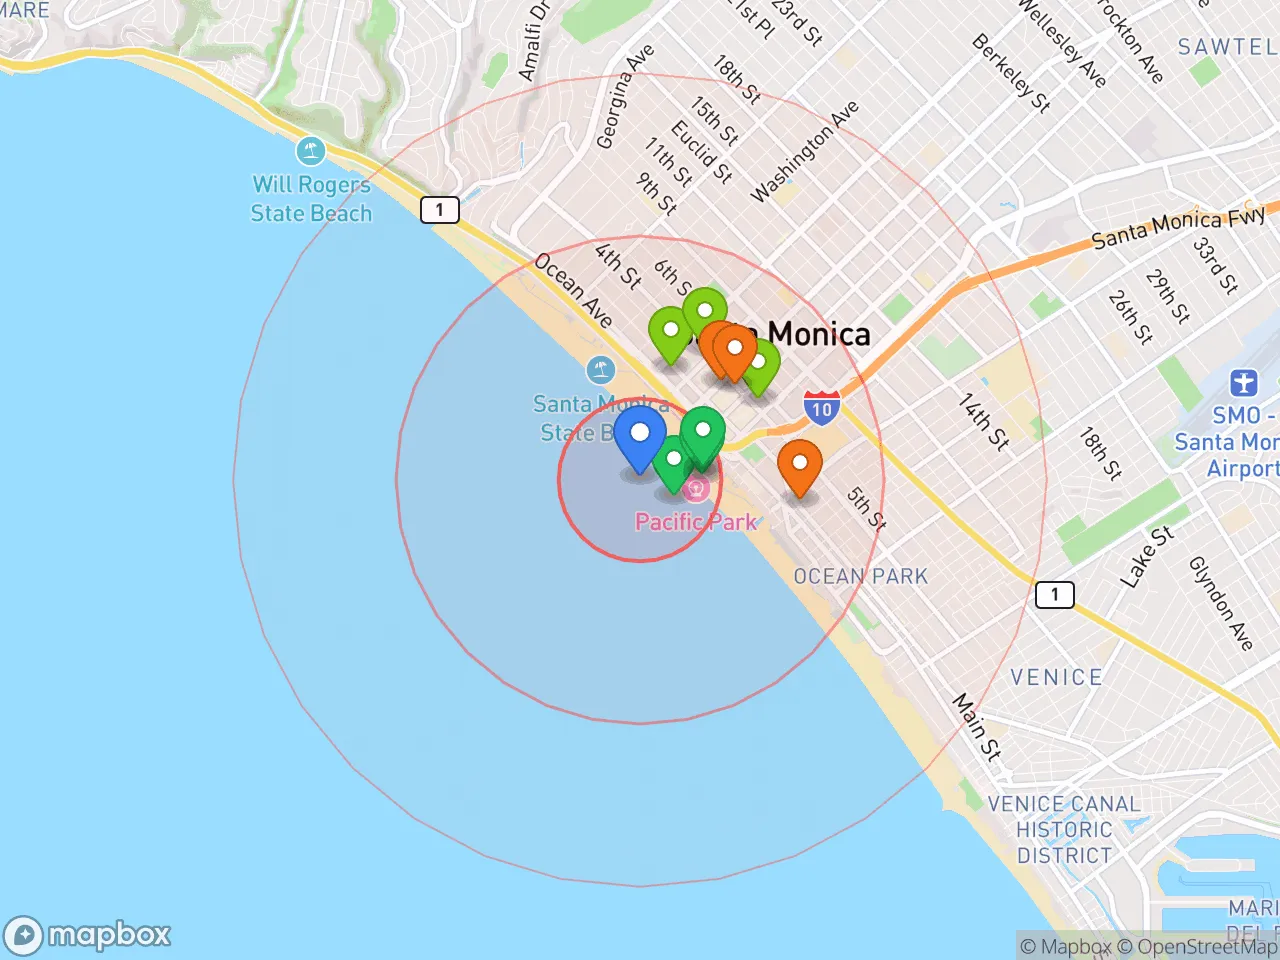
Critical Amenities
Quality-of-Life Analysis
Santa Monica, California, is a high-cost, high-amenity coastal city where the median home value of $1,810,200 and a cost-of-living index of 377 (more than 3.7 times the U.S. average) create a demographic profile dominated by affluent professionals, tech and entertainment workers, and long-established families. The city’s population of roughly 90,000 is notably educated and white-collar, with a median household income exceeding $100,000, though the steep housing costs mean that renters and younger workers often face significant financial pressure. Santa Monica’s identity is shaped by its beachfront location, progressive politics, and dense urban fabric, attracting those who prioritize walkability, climate, and cultural access over square footage or suburban space.
Cost of living, housing, and how Santa Monica compares to nearby cities
Santa Monica’s cost-of-living index of 377 is among the highest in Los Angeles County, driven almost entirely by housing. The median home value of $1,810,200 is roughly 40% higher than the Los Angeles citywide median and about double the national average, while the median rent of $2,338 per month is slightly below the city’s astronomical purchase prices but still well above the national median. Compared to neighboring Venice and Marina del Rey, Santa Monica is generally pricier for single-family homes but can be comparable for apartments; compared to less coastal areas like Culver City or West Los Angeles, Santa Monica commands a 15–25% premium. The average commute of 25.8 minutes is shorter than the Los Angeles metro average of roughly 30 minutes, reflecting the high share of residents who work locally in Santa Monica’s tech hub (e.g., Snap Inc., Hulu) or in nearby Westside employment centers. Property taxes are capped by Proposition 13, but renters face a tight market where vacancy rates hover around 3–4%, making affordability a persistent challenge for middle-income households.
What daily life is like: amenities, schools, and neighborhood rhythm
Daily life in Santa Monica revolves around the beach, the Third Street Promenade, and a dense network of parks, farmers markets, and bike lanes. The Santa Monica-Malibu Unified School District is highly rated, with schools like Lincoln Middle School and Santa Monica High School consistently scoring in the top 10–15% of California public schools, though competition for enrollment is fierce. The city’s 3.5-mile coastline, including the Santa Monica Pier and Palisades Park, provides year-round outdoor recreation, while the Expo Line light rail connects downtown Santa Monica to downtown Los Angeles in about 50 minutes. The rhythm is distinctly Westside: mornings filled with coffee shops and yoga studios, afternoons at the beach or the Santa Monica Place mall, and evenings at independent restaurants and bars along Main Street or Montana Avenue. Crime rates are moderate for a dense urban area, with property crime (especially bike theft and car break-ins) being the most common complaint, while violent crime is below the Los Angeles city average.
Santa Monica is best suited for high-income professionals, families who can afford the housing premium for top-tier public schools, and retirees or remote workers who value beach access and walkability above all else. The city is less ideal for budget-conscious renters, car-dependent commuters heading to the San Fernando Valley or downtown LA, or those seeking a quiet suburban yard. For those with the financial flexibility to absorb the cost-of-living index of 377, Santa Monica offers a dense, amenity-rich coastal lifestyle that few other U.S. cities can match, but the trade-off in space and affordability is steep and unrelenting.
Crime in Santa Monica, CA
Significantly higher crime rates than 77% of comparable U.S. locations.
Violent CrimeViolent Crime Analysis
Property CrimeProperty Crime Analysis
Crime Analysis
Santa Monica, California, reports a violent crime rate of 618.7 incidents per 100,000 residents and a property crime rate of 4,106.7 per 100,000, figures that place it among the higher-risk communities in Los Angeles County. While the city benefits from a robust police presence and a walkable, tourist-friendly downtown core, these statistics reflect systemic challenges tied to its location within a large, progressive metro area. Readers should weigh these numbers carefully, as the local justice system’s ideological leanings directly influence public safety outcomes.
Crime in context
Santa Monica’s violent crime rate is roughly 1.6 times the national average of 380 per 100,000, while its property crime rate is nearly 2.5 times the national average of 1,700 per 100,000. Compared to California’s statewide violent crime rate of approximately 500 per 100,000, Santa Monica is about 24% higher. The city’s property crime rate is particularly stark, driven by vehicle break-ins, theft from retail stores along the Third Street Promenade, and package thefts in residential neighborhoods. These elevated rates are consistent with trends seen across the Los Angeles metro area, where progressive district attorneys and judges have implemented policies that prioritize diversion and reduced sentencing for non-violent offenders. While intended to reduce incarceration, these policies have resulted in higher recidivism and more criminals returning to the streets, directly impacting property and violent crime statistics.
What residents experience
Daily life in Santa Monica involves a heightened awareness of personal and property security. Residents commonly report car break-ins, even in secured parking garages, and theft from unlocked vehicles is a persistent issue. The city’s homeless population, estimated at over 1,000 individuals, contributes to visible street-level concerns, including aggressive panhandling and occasional confrontations. Violent crime, while less frequent than property crime, includes incidents of robbery and assault, particularly near transit hubs like the Downtown Santa Monica Metro station. The progressive judicial philosophy in Los Angeles County means that many offenders arrested for theft or drug-related crimes are released quickly, eroding trust in the justice system and leaving victims feeling underserved. For families and professionals, this translates into a need for constant vigilance—locking doors, avoiding solo nighttime walks in less-trafficked areas, and investing in home security systems.
Neighborhood-level variation is significant. The Ocean Park and Sunset Park areas near the beach tend to have lower violent crime rates due to higher property values and active neighborhood watches, but property theft remains a concern. In contrast, the Pico Boulevard corridor and areas near the Santa Monica Civic Auditorium experience higher rates of both violent and property crime, driven by proximity to commercial zones and transient populations. The city’s northern residential enclaves, such as the North of Montana district, report the lowest crime rates overall, though no neighborhood is immune to the region’s systemic challenges. Prospective residents should prioritize gated parking and buildings with secure entry, and consider the trade-offs between beachside living and the elevated crime risk inherent in a progressive metro area.
* Values derived from national, state, county, city and local statistics and may differ in a specific area. Last updated: 2026-06-08T04:53:42.000Z
Narrative content on this page is AI-generated and may contain mistakes. Verify any details that matter before acting on them.
ReloMaps may earn a commission from affiliate links at no extra cost to you.