Photo: Wikipedia
Demographics of Seatac, WA
Affluence Level in Seatac, WA
A middle-class area roughly in line with national averages across income, home values, education, and employment.
People of Seatac, WA
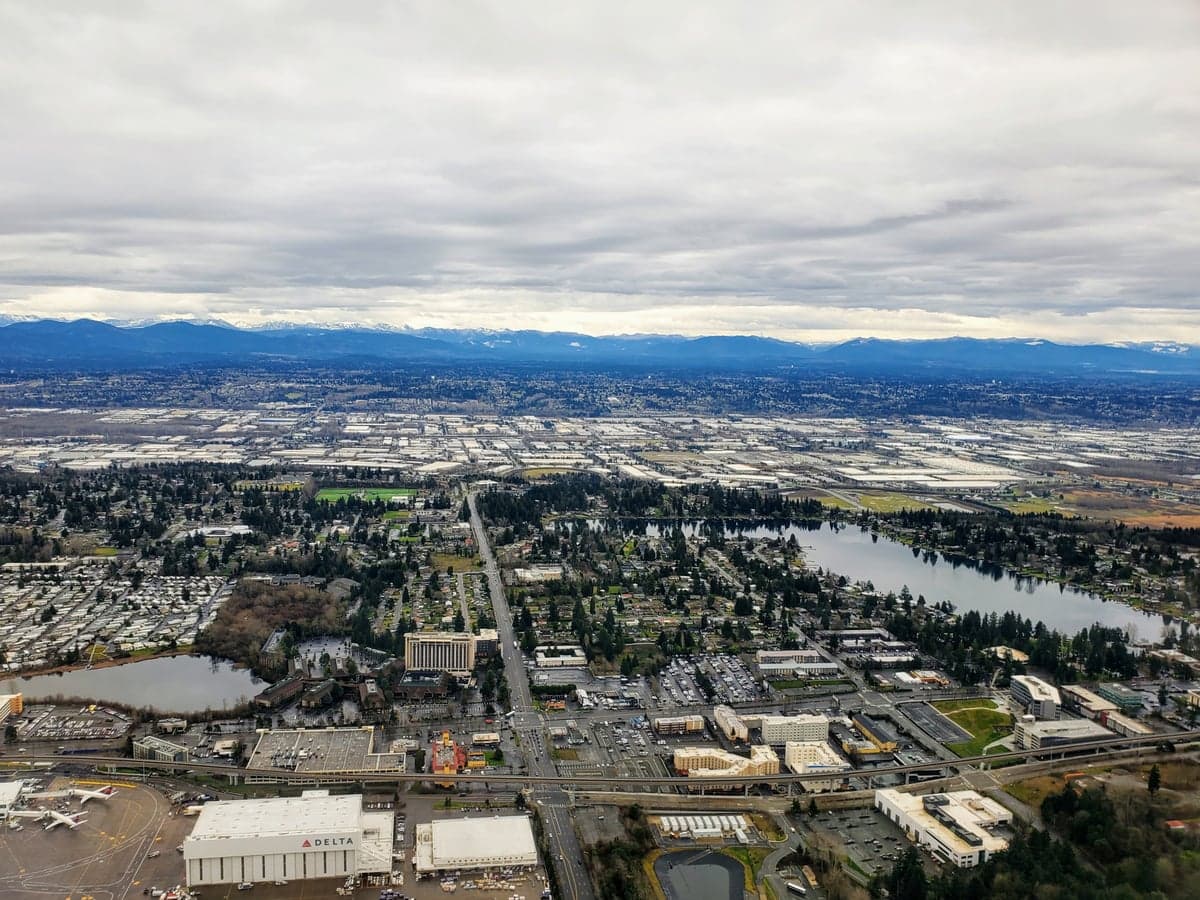
SeaTac, Washington, is a dense, working-class city of 31,143 residents defined by its extraordinary racial and ethnic diversity—a place where no single group holds a majority. Its population is a mosaic of White (29.3%), Black (23.9%), Hispanic (22.8%), East/Southeast Asian (12.8%), and Indian-subcontinent (3.0%) communities, with 19.3% foreign-born. The city’s identity is shaped by its role as a transportation and logistics hub around Seattle-Tacoma International Airport, attracting waves of immigrants and domestic migrants seeking affordable housing and airport-adjacent jobs.
How the city was settled and grew
SeaTac’s human history begins not with a founding settlement but with the mid-20th-century transformation of rural farmland and timberland into a modern suburb. The area was originally inhabited by the Duwamish and Coast Salish peoples, but the city’s recorded population history starts in the 1940s, when the U.S. Army built Fort Lawton (now part of Seattle) and the federal government constructed the Seattle-Tacoma International Airport, which opened in 1944. The airport drew the first major wave of workers—mostly White families from the Midwest and the Pacific Northwest—who settled in the Bow Lake and Angle Lake neighborhoods. These areas, characterized by modest single-family homes on large lots, became the core of the city’s early White middle-class population. By the 1950s, the city’s population was nearly all White, with a small number of Black families working as airport service staff living near Des Moines Creek.
Modern era (post-1965)
The 1965 Hart-Cellar Immigration Act fundamentally reshaped SeaTac. The act opened immigration from Asia, Africa, and Latin America, and the airport’s demand for low-skilled labor—baggage handlers, cleaners, food service workers—drew the first significant non-White populations. The McMicken Heights neighborhood, a cluster of post-war apartment complexes and duplexes, became the landing point for Vietnamese and Filipino families in the 1970s and 1980s. By 1990, the city’s White share had fallen to 65%, while East/Southeast Asian communities (primarily Vietnamese and Filipino) reached 12%. The 1990s and 2000s saw a second wave: Black families, many from the East African diaspora (Somali, Ethiopian), moved into Sunset and North SeaTac, drawn by affordable rentals and proximity to airport jobs. Hispanic immigration, largely from Mexico and Central America, accelerated after 2000, concentrating in the Valley Ridge area near Highway 99. The Indian-subcontinent community (Indian, Pakistani, Bangladeshi) grew later, from 2010 onward, settling in the Bow Lake area’s newer apartment complexes. Today, the city’s White share is just 29.3%, with Black (23.9%) and Hispanic (22.8%) communities nearly equal in size, and East/Southeast Asian (12.8%) and Indian (3.0%) groups forming significant minorities.
The future
SeaTac’s population is not homogenizing; it is tribalizing into distinct, stable enclaves. The White population is aging and declining, with many families moving to farther suburbs like Covington or Bonney Lake. The Black and Hispanic communities are growing through both immigration and higher birth rates, and they are consolidating in the Sunset and Valley Ridge neighborhoods, respectively. The East/Southeast Asian population is plateauing, as second-generation Vietnamese and Filipino families often leave for suburbs with better schools. The Indian-subcontinent community is the fastest-growing segment, driven by tech and logistics workers, and is likely to double its share to 6-7% by 2035. The city’s foreign-born share (19.3%) is stable, as new arrivals replace those who naturalize and move out. The next decade will likely see SeaTac become even more heavily Black and Hispanic, with the White share falling below 25% and the East/Southeast Asian share holding steady. The city’s character will remain working-class and transit-oriented, with a growing Indian presence in the Bow Lake area.
For someone moving in now, SeaTac is a place of authentic, unpolished diversity—a city where no single culture dominates and where the airport economy provides stable, if not high-paying, jobs. It is not a gentrifying hub or a suburban idyll; it is a dense, affordable, and genuinely multicultural community where the population is becoming more Black and Hispanic, with a rising Indian minority. The city’s future is one of continued ethnic clustering, not assimilation, making it a unique and grounded choice for those who value real diversity over curated demographics.
* Values derived from national, state, county, city and local statistics and may differ in a specific area. Last updated: 2026-04-21T11:15:05.000Z
Narrative content on this page is AI-generated and may contain mistakes. Verify any details that matter before acting on them.
ReloMaps may earn a commission from affiliate links at no extra cost to you.