Photo: Wikipedia
Quality of Life in Seatac, WA
A high quality of life with strong walkability, manageable living costs, healthy neighborhood signals, and solid amenity access.
What does Quality of Life tell us?
Quality of Life blends cost of living, nearby amenities, socioeconomic signals, and neighborhood character. City-level scores represent the whole municipality; individual neighborhoods can differ.
What does this tell us?
Quality of Life blends cost of living, nearby amenities, socioeconomic signals, and neighborhood character. City-level scores represent the whole municipality; individual neighborhoods can differ.
Cost of Living
53% above national average
The Real Cost of Living in Seatac, WA for 2026
| Tier | Individual | Family (4) |
|---|---|---|
| Survival | $26k | $49k |
| Comfortable | $79k | $117k |
| Luxury | $116k+ | $180k+ |
| Elite (Top 5%) | $137k+ | $212k+ |
66%
The Area Signal
A metric tracking the socioeconomic signals of the area.
Hobbies
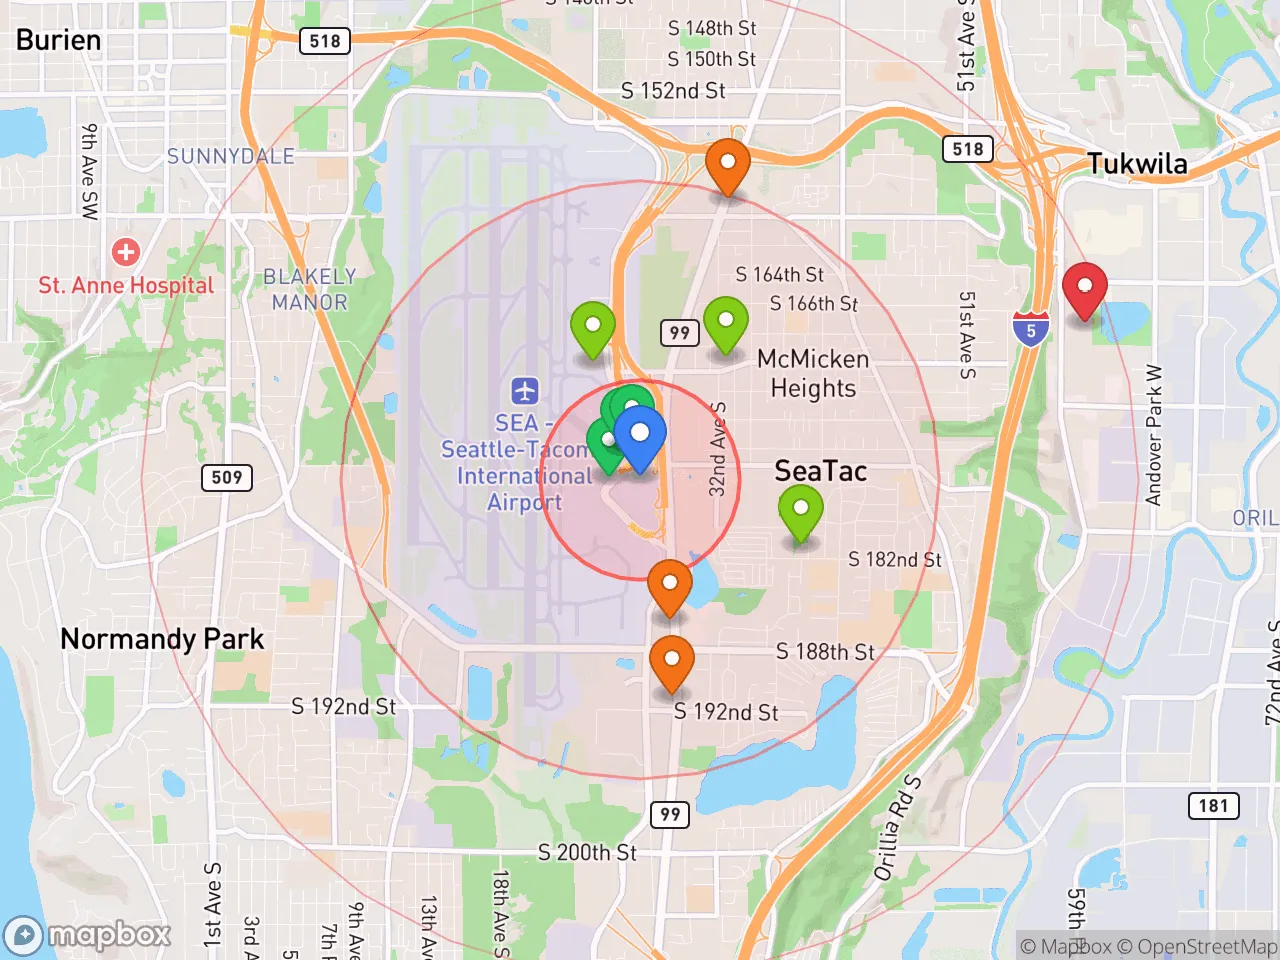
Explore the areaGroceries
0 within 10 miles
Gas
0 within 10 miles
Hospital
0 within 20 miles
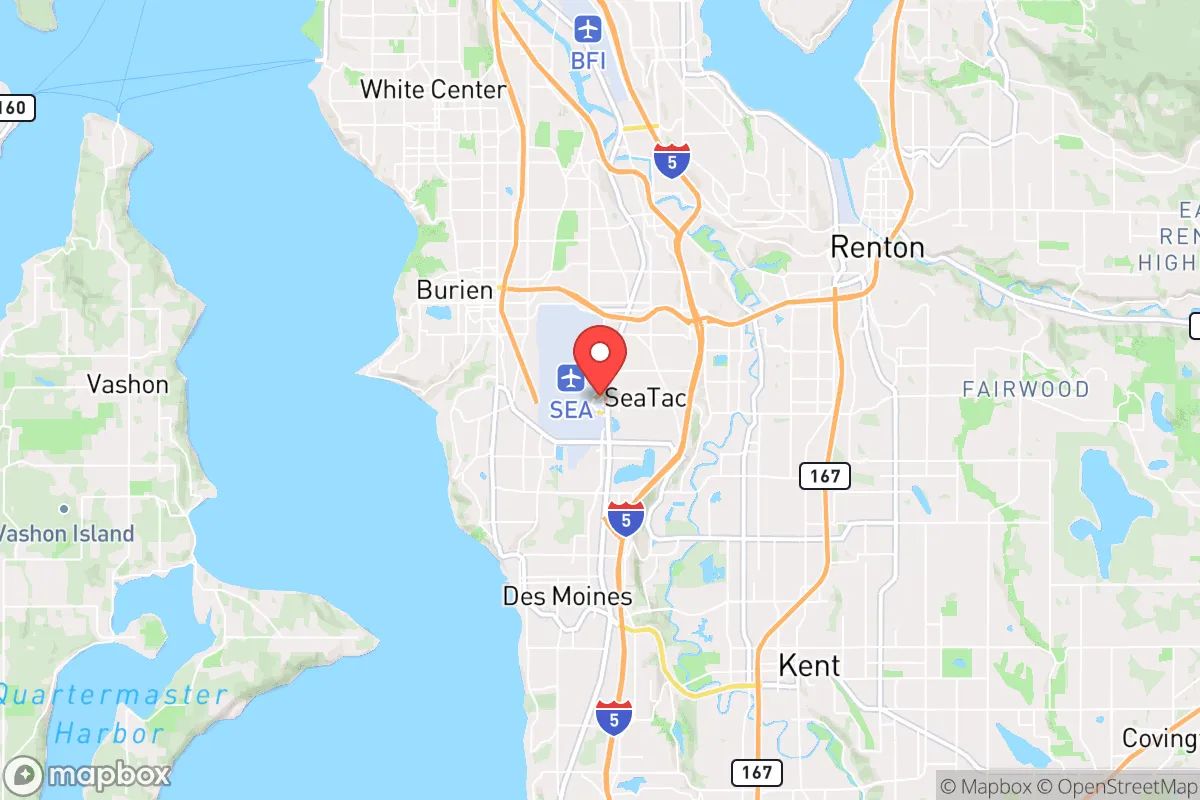
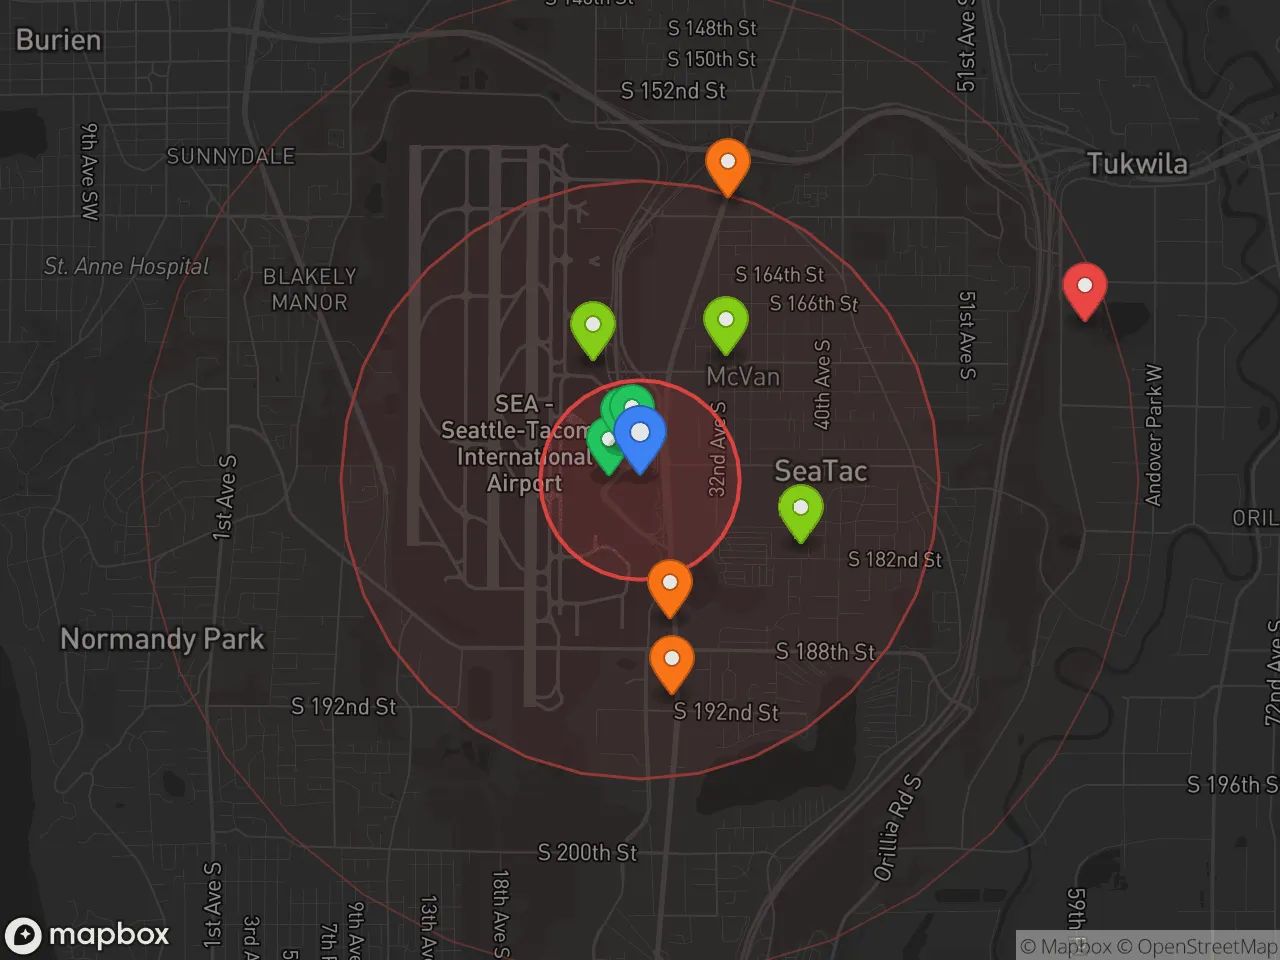
Airport
SEA — Seattle–Tacoma International
Post Office
Critical Amenities
Quality-of-Life Analysis
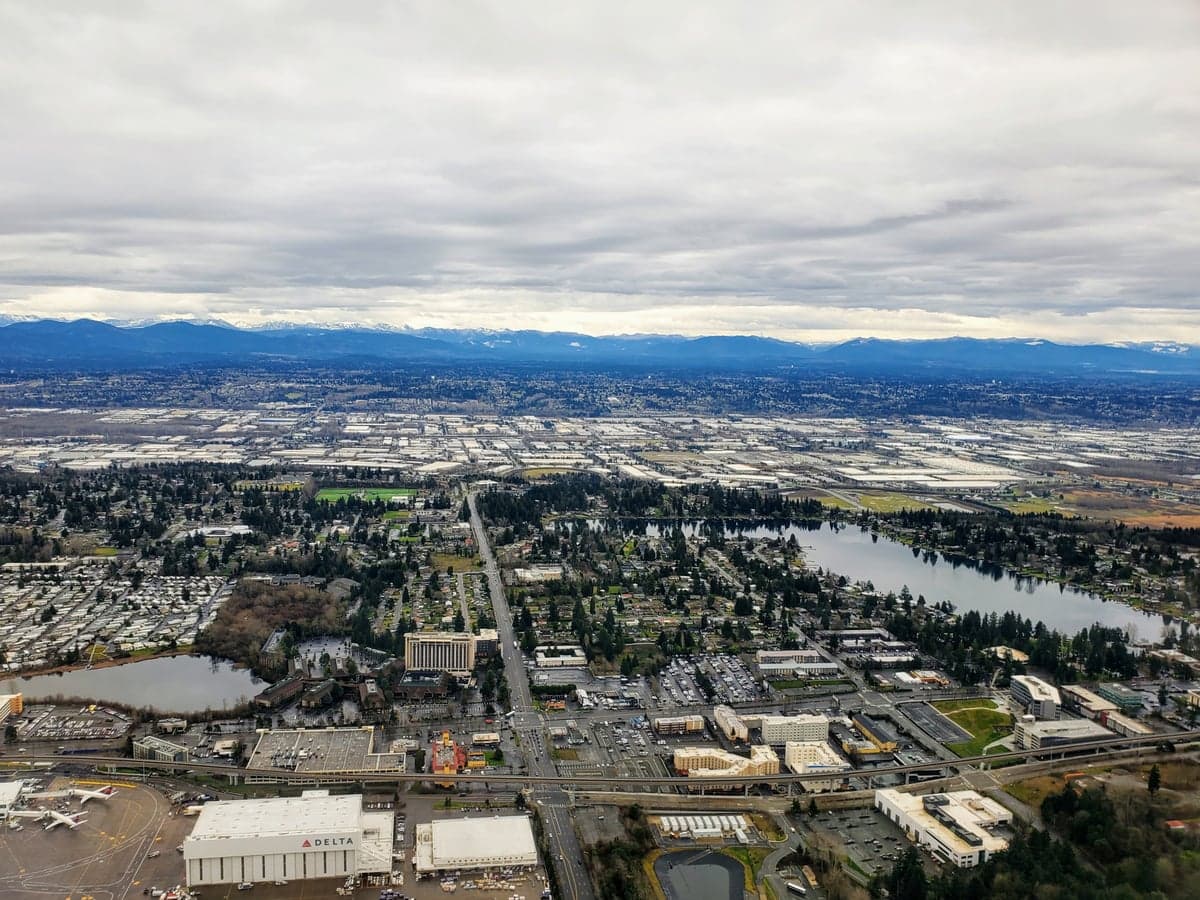
Seatac, Washington, presents a quality-of-life profile that is distinctly middle-market for the Seattle metro area, with a cost of living index of 153 (53% above the U.S. average) that places it well below Seattle proper. The city is a practical choice for airport employees, logistics workers, and service professionals who need proximity to Sea-Tac Airport and the region’s job centers without the premium price tags of Bellevue or downtown Seattle. Its population is notably diverse and working-class, with a median household income that trails the county average, reflecting a community built around the rhythms of aviation, warehousing, and transportation rather than tech headquarters or waterfront luxury.
Cost of living and housing affordability compared to Seattle and Burien
Seatac’s housing market is the primary driver of its affordability advantage relative to the broader King County region. The median home value sits at $483,200, which is roughly 40% lower than the Seattle city median and significantly below the Eastside suburbs like Redmond or Kirkland. For renters, the median rent of $1,637 is attainable for a one-bedroom unit, though it still represents a stretch for households earning the area’s median income of around $65,000. Compared to neighboring Burien, Seatac offers slightly lower home prices, while Renton and Tukwila are close competitors in the same price band. The trade-off for this relative affordability is a higher density of multi-family housing and older single-family stock, much of it built before 1980. Property taxes remain moderate by King County standards, but the overall cost of living index of 153 means that everyday expenses—groceries, utilities, and transportation—are elevated compared to national norms, driven largely by Washington’s lack of a state income tax and high sales tax rates.
Daily life, local amenities, and school options in Seatac
Daily life in Seatac is heavily shaped by the presence of Sea-Tac Airport, which provides both employment and ambient noise. The city’s amenities are practical rather than picturesque: Angle Lake Park offers a swimming beach and walking trails, while the Seatac Community Center hosts recreation programs and a public pool. The Highline School District serves the area, with Tyee High School and Chinook Middle School being the primary public options; both have received below-average state test scores, which is a common concern for families weighing the district against nearby private or magnet schools. The average commute of 25.6 minutes is shorter than Seattle’s citywide average of 30+ minutes, thanks to direct access to I-5, SR 518, and the Link Light Rail station at the airport, which connects riders to downtown Seattle in about 35 minutes. Grocery shopping is served by a mix of national chains and ethnic markets, reflecting the city’s large Somali, Ethiopian, and Vietnamese communities. Nightlife is limited to a handful of sports bars and casual restaurants near International Boulevard, with most residents heading to Burien’s Olde Burien district or downtown Seattle for more variety.
Seatac is best suited for individuals and families who prioritize affordability and commute convenience over school rankings or upscale amenities. Airport employees, warehouse workers, and service professionals will find the housing costs manageable and the transit connections excellent, while remote workers or those seeking a quiet suburban lifestyle may find the noise and density off-putting. The city’s diversity and working-class character offer a grounded, no-frills quality of life that contrasts sharply with the polished suburbs to the east, making it a pragmatic base for those whose daily lives revolve around the region’s transportation and logistics economy.
Crime in Seatac, WA
Generally safer than 64% of comparable U.S. locations.
Violent CrimeViolent Crime Analysis
Property CrimeProperty Crime Analysis
Crime Analysis
SeaTac, Washington, presents a challenging safety profile, with crime rates that significantly exceed both state and national averages. The city's violent crime rate stands at 138.3 incidents per 100,000 residents, while property crime is reported at 1,215.5 per 100,000. These figures place SeaTac in a higher-risk category, particularly for property-related offenses, which are a primary concern for residents and those considering relocation to this King County community.
Crime in context
SeaTac's property crime rate of 1,215.5 per 100,000 is roughly 2.5 times higher than the national average and significantly above Washington state's already elevated rate. Violent crime, while lower than property crime, still exceeds the national median. The city's proximity to Seattle-Tacoma International Airport, major highways like I-5 and SR 518, and a dense concentration of hotels and rental properties creates a transient population that contributes to these figures. As part of the broader Seattle metropolitan area, SeaTac is affected by regional trends, including the policies of King County's progressive justice system. Liberal prosecutorial policies and lenient sentencing guidelines in the region have been linked to reduced consequences for repeat offenders, which critics argue directly increases the number of criminals on the street and undermines public safety and victim justice.
What residents experience
Residents most frequently encounter property crimes such as vehicle break-ins, theft from parked cars, package theft, and residential burglaries. The city's dense, mixed-use areas near the airport and along International Boulevard are hotspots for these incidents. Violent crimes, including aggravated assault and robbery, occur less frequently but are concentrated in the same high-traffic zones. Car theft and theft from vehicles are the most common complaints logged with the SeaTac Police Department. The presence of short-term rental units and hotels means that many crimes are opportunistic, targeting unattended vehicles and unsecured property. Residents often report a sense of unease in parking lots and near transit hubs, particularly after dark.
Neighborhood-level variation
Safety conditions vary notably across SeaTac. The areas immediately surrounding the airport, including the commercial corridors along International Boulevard and Pacific Highway South, experience the highest concentration of crime, especially property offenses and drug-related activity. In contrast, the residential neighborhoods east of I-5, such as the areas near Angle Lake Park and the North SeaTac Park vicinity, tend to have lower crime rates. Properties near the light rail stations at Angle Lake and SeaTac/Airport also see elevated theft rates due to easy access for offenders. Prospective residents should prioritize homes in quieter, single-family zones away from major commercial strips and transit hubs to reduce exposure to crime. Overall, while SeaTac offers convenience for airport workers and commuters, its safety profile demands vigilance and proactive security measures.
* Values derived from national, state, county, city and local statistics and may differ in a specific area. Last updated: 2026-04-21T11:15:05.000Z
Narrative content on this page is AI-generated and may contain mistakes. Verify any details that matter before acting on them.
ReloMaps may earn a commission from affiliate links at no extra cost to you.