Photo: Wikipedia
Demographics of Suffolk, VA
Affluence Level in Suffolk, VA
A middle-class area roughly in line with national averages across income, home values, education, and employment.
People of Suffolk, VA
The people of Suffolk, VA today form a nearly evenly split Black and White community of 96,638 residents, with a very small foreign-born population of just 1.7%. The city is characterized by a strong native-born, multi-generational character, where 32.4% of adults hold a college degree and the population is notably less diverse than the national average in terms of immigrant origins. Distinctive identity markers include a deep-rooted African American community concentrated in historic neighborhoods and a growing suburban family population drawn by affordable housing and proximity to the Hampton Roads job market.
How the city was settled and grew
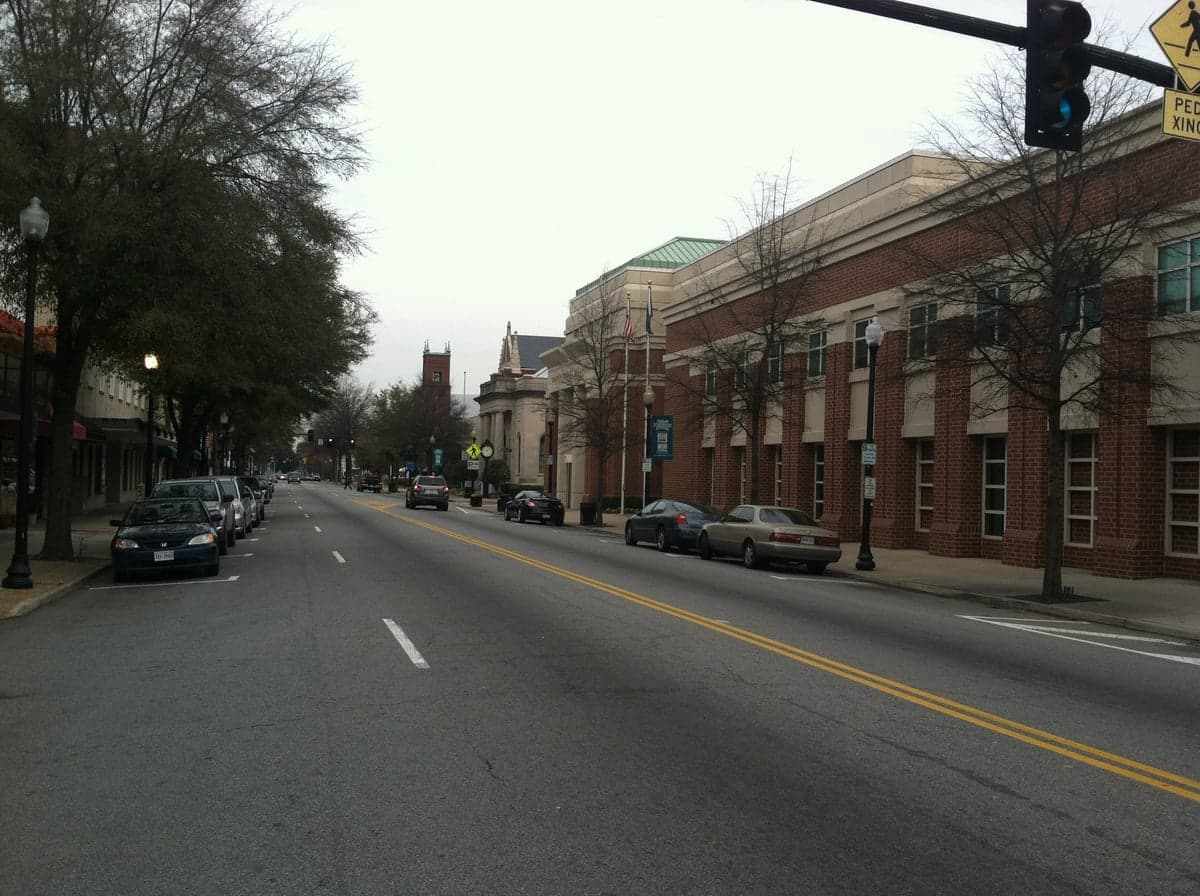
Suffolk’s population history begins with its founding in 1742 as a port town on the Nansemond River, built on the back of the peanut and timber industries. The original European settlers were primarily English planters who established large land grants, and enslaved Africans were brought in to work the plantations, forming the foundation of the city’s substantial Black population. By the early 20th century, Suffolk had become known as the “Peanut Capital of the World,” drawing a wave of rural White and Black laborers from surrounding counties into the city’s processing plants and rail yards. The historic Downtown Suffolk district and the Holland area (a former independent town) were the primary landing points for these early industrial workers, with Black families settling heavily in the East Suffolk and South Suffolk neighborhoods, which remain predominantly African American today. The city’s growth remained modest through the mid-20th century, with the population hovering around 30,000 as late as 1960.
Modern era (post-1965)
The post-1965 era brought significant demographic change through domestic in-migration rather than foreign immigration. The 1960s and 1970s saw the construction of Interstate 664 and the expansion of the Hampton Roads Bridge-Tunnel, which transformed Suffolk from a sleepy agricultural town into a suburban bedroom community for Norfolk and Virginia Beach. White families began moving into newly developed subdivisions in North Suffolk (areas like Harbour View and Sleepy Hole), drawn by larger lots and lower taxes than the urban core. Meanwhile, the city’s Black population remained concentrated in the older southern and eastern neighborhoods, with the Whaleyville area retaining a strong rural African American identity. The foreign-born population remained negligible throughout this period, never exceeding 2%, and the Hispanic share grew only slowly to 4.9% by 2020, with most settling in the Harbour View corridor for service-industry jobs. The Asian population (East/Southeast Asian) stands at just 1.5%, and the Indian subcontinent population at 0.4%, both concentrated in the newer subdivisions of North Suffolk near the tech and defense jobs of Hampton Roads.
The future
Suffolk’s population is heading toward continued suburbanization and a gradual homogenization of its northern half, while the southern half remains more economically and racially distinct. The city is not tribalizing into stark enclaves—rather, the newer developments in North Suffolk are attracting a mix of White, Black, and Hispanic families, blurring the old racial lines. However, the southern neighborhoods like Whaleyville and East Suffolk are seeing slower growth and aging populations, which could lead to a widening economic gap between north and south. The immigrant communities are not growing significantly; the foreign-born share is projected to remain below 3% for the next decade, meaning Suffolk will stay a predominantly native-born city. The Hispanic share may rise modestly to 6-7% by 2035, driven by construction and logistics jobs tied to the Port of Virginia expansion. The East/Southeast Asian and Indian populations are likely to remain small, plateauing at current levels unless a major employer relocates to the area.
For someone moving in now, Suffolk is becoming a stable, family-oriented suburb where the population is more defined by geography (north vs. south) than by ethnic tribalism. The city offers a middle-ground experience—more affordable than Virginia Beach, more diverse than Chesapeake, and with a strong sense of local history that is rare in the fast-growing Hampton Roads region. The low foreign-born share means English is the near-universal language, and the cultural texture is distinctly American, shaped by the interplay of its Black and White native-born populations.
* Values derived from national, state, county, city and local statistics and may differ in a specific area. Last updated: 2026-05-02T02:13:14.000Z
Narrative content on this page is AI-generated and may contain mistakes. Verify any details that matter before acting on them.
ReloMaps may earn a commission from affiliate links at no extra cost to you.