Photo: Wikipedia
Quality of Life in Thornton, CO
A high quality of life with strong walkability, manageable living costs, healthy neighborhood signals, and solid amenity access.
What does Quality of Life tell us?
Quality of Life blends cost of living, nearby amenities, socioeconomic signals, and neighborhood character. City-level scores represent the whole municipality; individual neighborhoods can differ.
What does this tell us?
Quality of Life blends cost of living, nearby amenities, socioeconomic signals, and neighborhood character. City-level scores represent the whole municipality; individual neighborhoods can differ.
Cost of Living
62% above national average
The Real Cost of Living in Thornton, CO for 2026
| Tier | Individual | Family (4) |
|---|---|---|
| Survival | $29k | $54k |
| Comfortable | $94k | $138k |
| Luxury | $139k+ | $216k+ |
| Elite (Top 5%) | $164k+ | $254k+ |
73%
The Area Signal
A metric tracking the socioeconomic signals of the area.
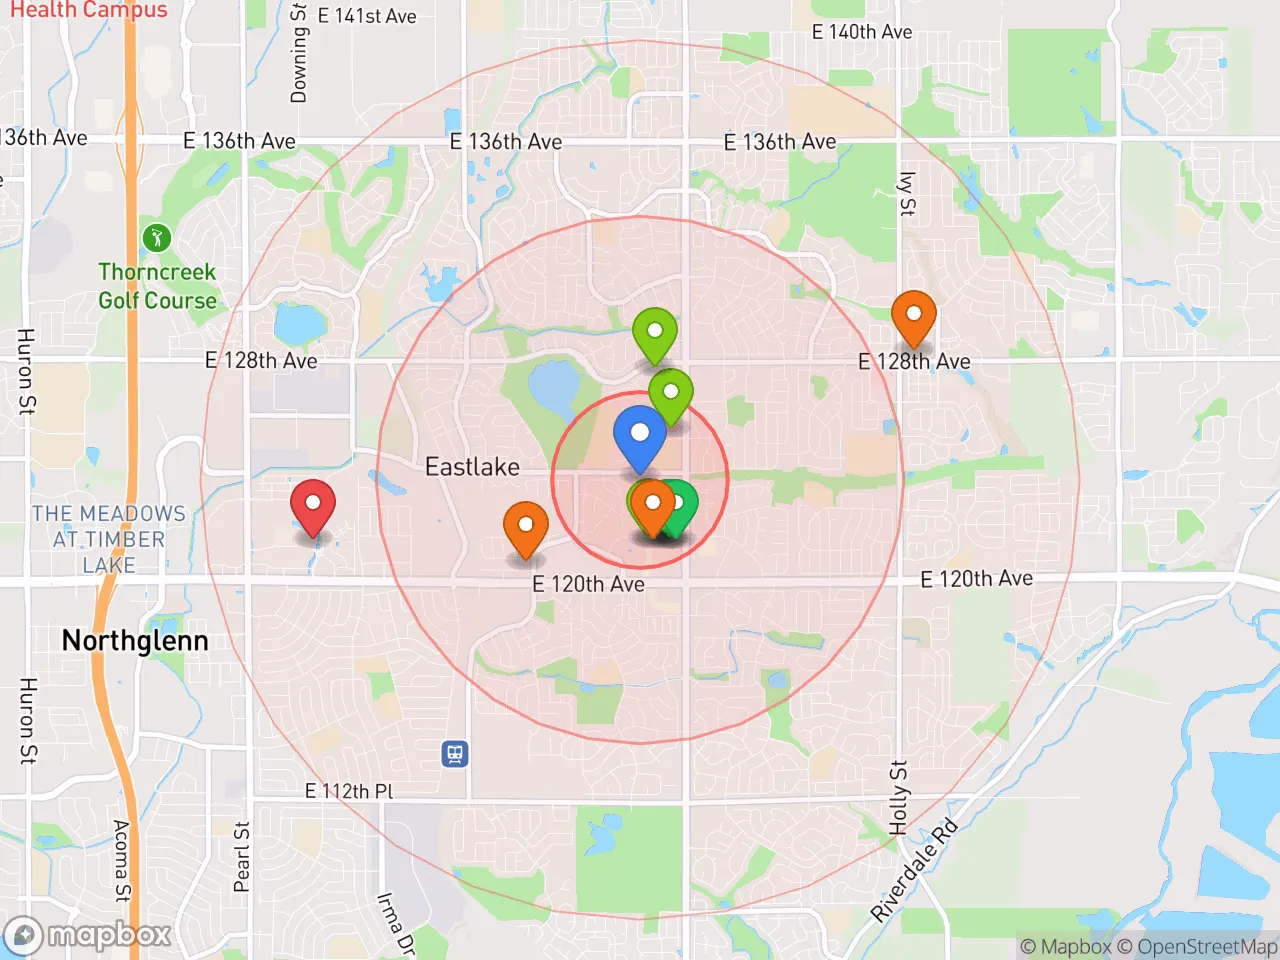
Hobbies
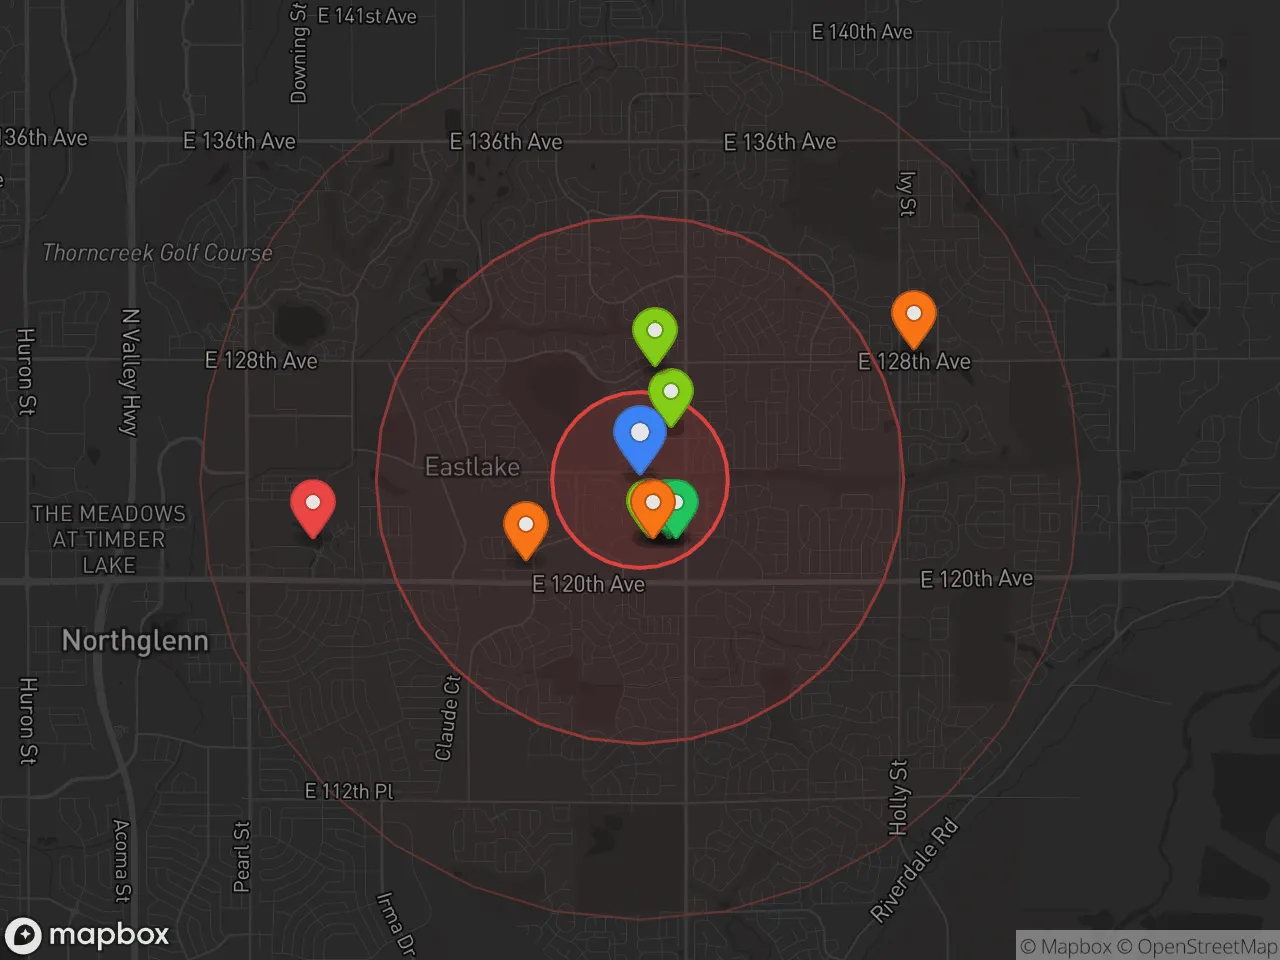
Explore the areaGroceries
7 within 10 miles
Gas
20 within 10 miles
Hospital
20 within 20 miles
Airport
DEN — Denver International
Post Office
USPS — Thornton, CO
Critical Amenities
Quality-of-Life Analysis
Thornton, Colorado, presents a quality of life shaped by its position as a more affordable alternative to Denver while still offering strong economic opportunity and suburban amenities. With a cost of living index of 162 (100 being the U.S. average), the city is notably more expensive than the national norm but remains a relative bargain compared to Denver’s index of 135 and Boulder’s 180. The population skews toward working professionals and families drawn by the balance of proximity to Front Range jobs and a quieter, family-oriented environment, with a median age of 34.5 reflecting a mix of young homeowners and established residents.
Cost of living, housing affordability, and how Thornton compares to nearby cities
Thornton’s housing market is the primary driver of its elevated cost of living, with a median home value of $482,200 and median rent of $1,810. These figures are roughly 15% lower than Denver’s median home value of $570,000 and 10% below the Denver metro average rent of $2,000, making Thornton a practical entry point for buyers and renters priced out of central Denver. However, the city is still 20–30% more expensive than more distant suburbs like Brighton (median home value $440,000) or Greeley ($380,000). The average commute of 30.9 minutes—slightly above the national average of 26 minutes—reflects the trade-off: residents gain housing affordability but spend more time traveling to employment hubs in Denver, Boulder, and the Denver Tech Center. Property taxes in Adams County average 0.56% of assessed value, lower than Denver’s 0.63%, which helps offset some monthly costs for homeowners.
Schools, parks, and the daily rhythm of life in Thornton
Daily life in Thornton is defined by its extensive park system—over 50 parks and 30 miles of trails—and a strong sense of community anchored by the Thornton Community Center and the nearby Rocky Mountain Arsenal National Wildlife Refuge. The city is served by Adams 12 Five Star Schools, which includes several highly rated elementary schools like Stellar Elementary and Silver Creek Elementary, though high school options are more mixed, with Horizon High School earning a 7/10 GreatSchools rating. The retail landscape is dominated by the Orchard Town Center, a large outdoor mall with national chains, and local dining along Washington Street. Commuting patterns are a central feature of daily life: over 70% of Thornton residents drive alone to work, and the city’s lack of a direct light rail connection means most rely on I-25 or E-470, which can see congestion during peak hours. For families, the rhythm includes weekend trips to nearby Boulder or Denver for cultural events, while weekdays revolve around school drop-offs and local errands.
Who thrives in Thornton and what to consider before moving
Thornton is best suited for middle-to-upper-middle-income families and professionals who prioritize housing affordability and suburban amenities over urban walkability or nightlife. The city’s demographic profile—roughly 60% white, 30% Hispanic or Latino, and a median household income of $82,000—reflects a diverse, family-centric community. Those who thrive here are typically willing to accept a 30-minute commute in exchange for a newer, larger home and access to parks and schools. Retirees or singles seeking a vibrant downtown scene may find Thornton too quiet, as the city lacks a dense core and has limited entertainment options beyond chain restaurants and big-box retail. However, for buyers priced out of Denver or looking for a stable, growing suburb with good schools and outdoor access, Thornton offers a compelling, data-backed choice.
Crime in Thornton, CO
Generally safer than 59% of comparable U.S. locations.
Violent CrimeViolent Crime Analysis
Property CrimeProperty Crime Analysis
Crime Analysis
Thornton, Colorado, presents a mixed safety profile that demands careful consideration from potential residents. The city’s violent crime rate of 243.5 incidents per 100,000 residents is notably lower than the national average, but its property crime rate of 2,266.7 per 100,000 significantly exceeds both state and national benchmarks. As a large suburb within the Denver-Aurora-Lakewood metropolitan area, Thornton’s crime dynamics are heavily influenced by the broader regional justice system, which has adopted progressive prosecutorial policies that critics argue prioritize offender rehabilitation over public safety.
Crime in context
When compared to Colorado’s statewide violent crime rate of approximately 410 per 100,000, Thornton’s figure of 243.5 appears favorable. However, the property crime rate tells a different story: it is roughly 25% higher than the national average and well above Colorado’s own elevated property crime rate of about 2,100 per 100,000. The disparity is largely driven by theft and vehicle break-ins, which are common across the Front Range. The progressive policies of district attorneys in Adams County, where Thornton is located, have resulted in lower incarceration rates for property offenses, a factor that directly contributes to repeat offending and a higher volume of property crimes. This ideological approach, while sympathetic to offenders, has tangible consequences for residents’ daily security.
What residents experience
For those living in Thornton, the most immediate safety concern is property crime. Residents frequently report package thefts from porches, bicycle thefts from garages, and catalytic converter thefts from parked vehicles. Violent crime, while less common, is not absent—incidents of aggravated assault and robbery occur, often concentrated near commercial corridors like Washington Street and 88th Avenue. The progressive justice environment means that many offenders arrested for these crimes face reduced charges or diversion programs, leading to a perception among residents that the system does not adequately protect victims or deter future crime. This is a critical consideration for families and individuals who prioritize a conservative, law-and-order approach to community safety.
Neighborhood-level variation is significant in Thornton. Areas east of Interstate 25, particularly around the Thorntown neighborhood and older sections near the original town center, tend to report higher rates of both property and violent crime. In contrast, newer master-planned communities in the western parts of the city, such as those near Eastlake and the Thornton Recreation Center, generally experience lower crime rates. However, even in these safer pockets, the influence of the county’s progressive criminal justice policies means that residents cannot fully escape the risk of property crime. For those considering a move, a thorough review of block-level crime maps and conversations with local police precincts are strongly advised before committing to a specific address.
* Values derived from national, state, county, city and local statistics and may differ in a specific area. Last updated: 2026-05-02T12:31:51.000Z
Narrative content on this page is AI-generated and may contain mistakes. Verify any details that matter before acting on them.
ReloMaps may earn a commission from affiliate links at no extra cost to you.