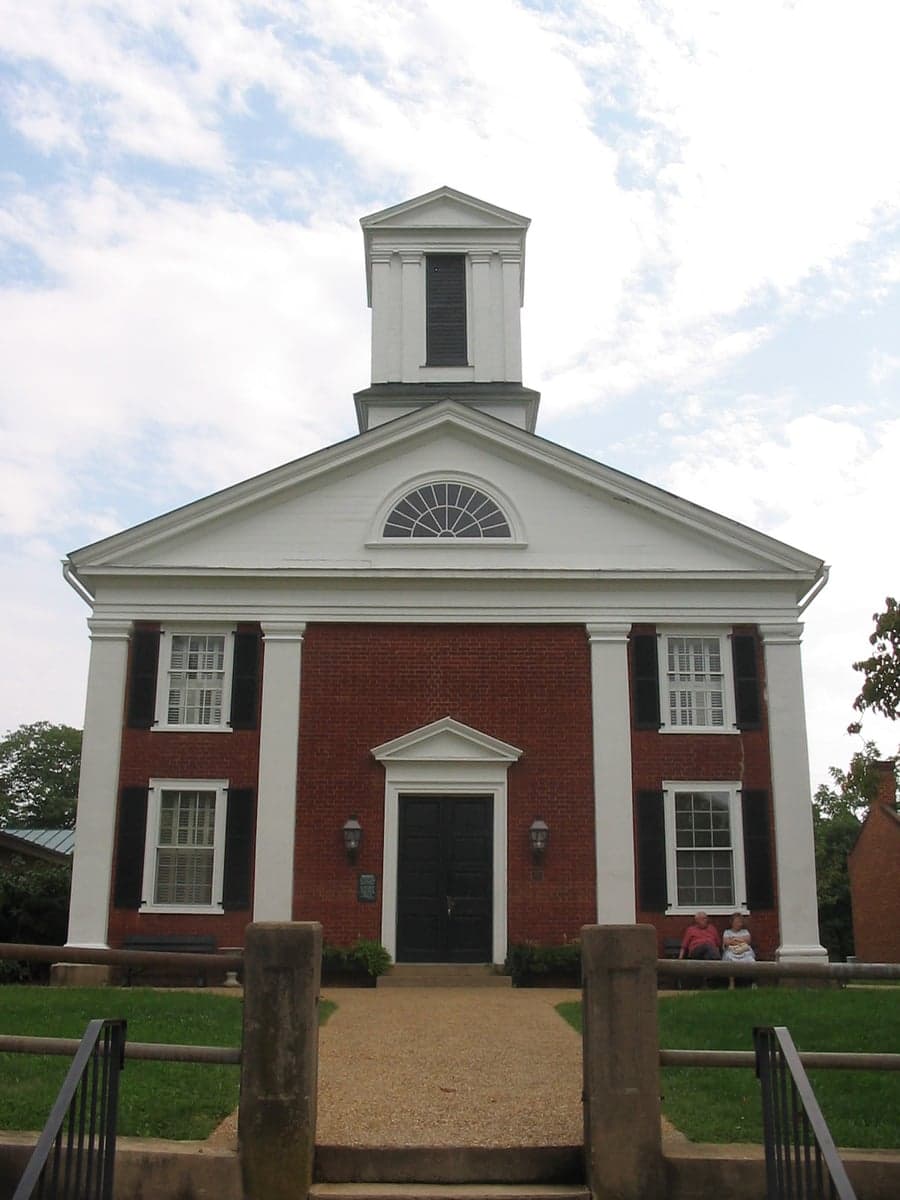
Photo: Wikipedia
Demographics of Rappahannock County
Affluence Level in Rappahannock County
A middle-class area roughly in line with national averages across income, home values, education, and employment.
People of Rappahannock County
Rappahannock County, Virginia, is home to roughly 7,400 residents who form one of the most rural and politically distinctive populations in the Washington, D.C., exurbs. The county is overwhelmingly white (85.7%) with a small but notable Black population (4.8%) and a growing Hispanic community (4.5%), while foreign-born residents make up just 2.8% of the total. Its identity is shaped by a deep agricultural heritage, a strong tradition of land conservation, and a recent influx of retirees and telecommuters seeking solitude in the Blue Ridge foothills. The county has no stoplights, no major employers, and a population density of roughly 20 people per square mile — making it one of the least populated counties in Virginia east of the Shenandoah Valley.
Settlement & growth (pre-1960)
Long before European settlers arrived, the area now known as Rappahannock County was part of the seasonal hunting and trading grounds of the Siouan-speaking Manahoac Confederacy, as well as the Iroquoian-speaking Susquehannock to the north. The Rappahannock River, which forms the county's southern border, was a major travel corridor, but no permanent Native villages are recorded within the county's boundaries — the steep, rocky terrain was better suited for hunting than year-round habitation. By the early 1700s, English colonists from Virginia's Tidewater region had pushed westward, displacing the native peoples through treaty and warfare.
The first permanent European settlers arrived in the 1720s and 1730s, almost exclusively English and Scots-Irish farmers moving up from the Piedmont. They were drawn by the promise of cheap, fertile land in the Rappahannock River valley and the relative safety of the Blue Ridge frontier. The town of Washington, established in 1796 and named for George Washington, became the county seat and remains the only incorporated town in Rappahannock County. It was laid out on land donated by local planter John Voss, and its grid of streets still reflects the original 18th-century plan. Nearby Sperryville, founded around 1820 at the confluence of the Thornton and Hazel Rivers, grew as a milling and trading center for the surrounding farms.
Throughout the 19th century, the county's economy was based on small-scale tobacco and grain farming, with enslaved African Americans making up roughly 35% of the population by 1860. After the Civil War, many freedmen remained in the county, forming tight-knit communities in areas like Woodville and Fletcher, where they worked as sharecroppers and tenant farmers. The county's population peaked at around 10,000 in 1880, then began a long decline as the agricultural economy faltered and younger generations left for industrial jobs in Northern Virginia and Washington, D.C. By 1930, the population had fallen to roughly 7,000, where it would remain largely stagnant for the next 60 years.
The 20th century brought little new settlement. The county remained overwhelmingly rural and agricultural, with no railroad and only narrow dirt roads connecting its hamlets. A small number of German and Irish families arrived in the 1910s and 1920s to work in the apple orchards that had become a major crop, but no large immigrant wave ever materialized. The county's isolation preserved its character but also limited its growth — by 1960, the population was still under 7,000, and the economy was dominated by cattle farming, apple orchards, and a handful of small sawmills.
Modern era (post-1965)
The 1965 Hart-Cellar Act had almost no direct effect on Rappahannock County's demographics. The county's foreign-born population remains minuscule at 2.8%, and the small Asian (East/Southeast Asian) community of 0.2% and Indian subcontinent population of 0.0% reflect the county's lack of the urban job centers or ethnic enclaves that attract immigrants. Instead, the county's modern demographic story is one of domestic migration — specifically, the gradual arrival of affluent white professionals from the Washington, D.C., metropolitan area.
Beginning in the 1970s and accelerating through the 1990s, Rappahannock County became a destination for second-home buyers, retirees, and telecommuters seeking a rural escape within two hours of the capital. The towns of Washington and Sperryville saw a wave of renovation and gentrification, as old farmhouses were restored and converted into weekend homes. This influx brought new wealth and a higher proportion of college-educated residents — now 35.6% of the population — but also drove up property values and created tensions between longtime farming families and newcomers. The county's Black population, which had been roughly 15% in 1970, declined to 4.8% by 2020 as younger African Americans left for urban areas and older residents passed away without being replaced.
The Hispanic population, while still small at 4.5%, has grown steadily since the 1990s, driven largely by Mexican and Central American immigrants working in the county's apple orchards, vineyards, and landscaping businesses. These workers tend to settle in unincorporated areas like Huntly and Viewtown, where seasonal farm labor is concentrated. However, the community remains transient and largely undocumented, with few permanent enclaves or ethnic institutions. The county's overall racial and ethnic composition has shifted only modestly: white residents still make up 85.7% of the population, and the county remains one of the least diverse in Virginia.
The future
Rappahannock County's population is projected to remain stable or decline slightly over the next 10 to 20 years, as the county's strict land-use policies and lack of housing development limit new construction. The county has no zoning for subdivisions or apartment complexes, and the Rappahannock County Board of Supervisors has consistently rejected proposals for large-scale residential development. As a result, the population is likely to age in place, with the median age — already above 50 — continuing to rise. The Hispanic population may grow modestly as farm labor demand persists, but the county's high housing costs and limited social services make it unlikely to become a major destination for immigrant families.
The county is becoming slightly more diverse, but at a glacial pace. The Black population is expected to remain stable or decline further, while the small Asian and Indian communities are unlikely to grow significantly without new job creation. The most notable demographic trend is the continued arrival of affluent, college-educated retirees and remote workers from the D.C. area, who are drawn by the county's scenic beauty, low crime, and conservative political culture. This group is reshaping the county's economy — shifting it from agriculture toward tourism, hospitality, and services — but is also deepening the cultural divide between old-timers and newcomers.
Rappahannock County is becoming a place of deliberate, managed stasis — a rural enclave that resists the suburbanization sweeping much of Northern Virginia. For someone moving in now, the county offers a quiet, land-based lifestyle with strong community ties and a deeply conservative political ethos, but also limited economic opportunity, minimal ethnic diversity, and a housing market that increasingly prices out working-class families. It is a county that has chosen preservation over growth, and its future population will reflect that choice.

* Values derived from national, state, county, city and local statistics and may differ in a specific area. Last updated: 2026-09-19T01:45:25.000Z
Narrative content on this page is AI-generated and may contain mistakes. Verify any details that matter before acting on them.
ReloMaps may earn a commission from affiliate links at no extra cost to you.

