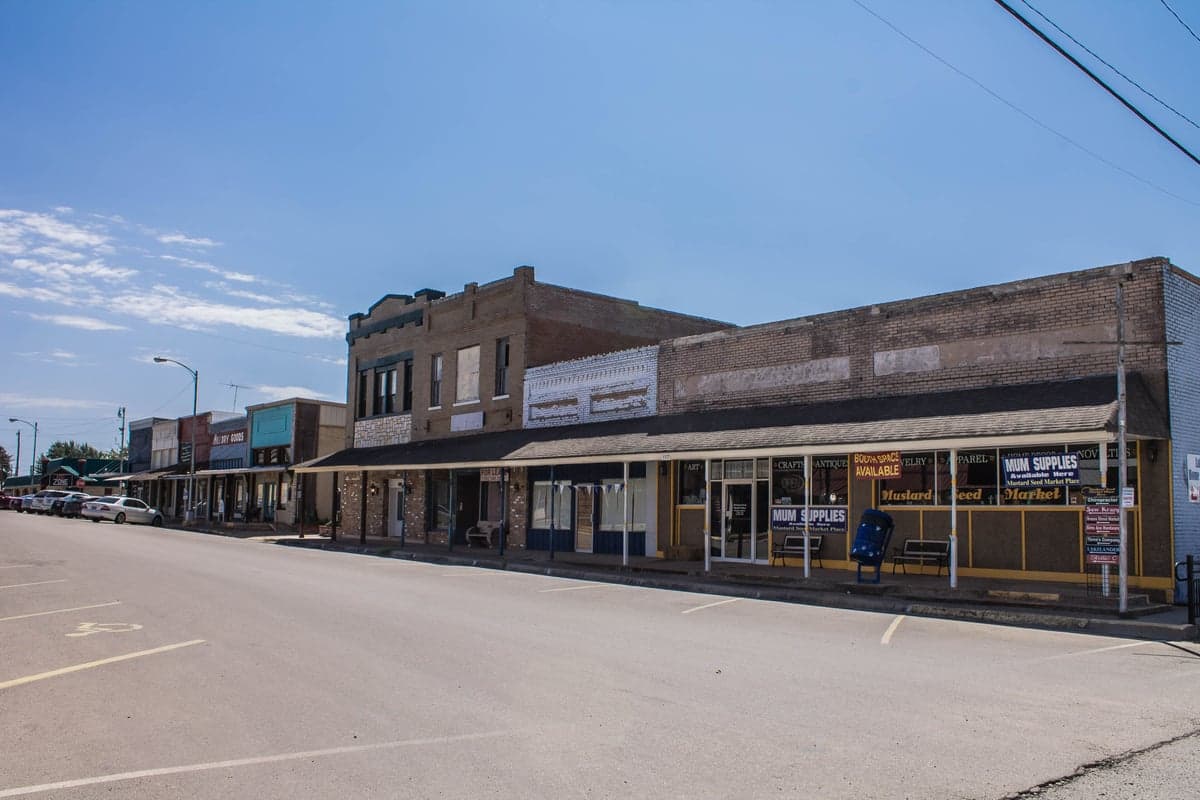
Photo: Courtney Rose via Unsplash
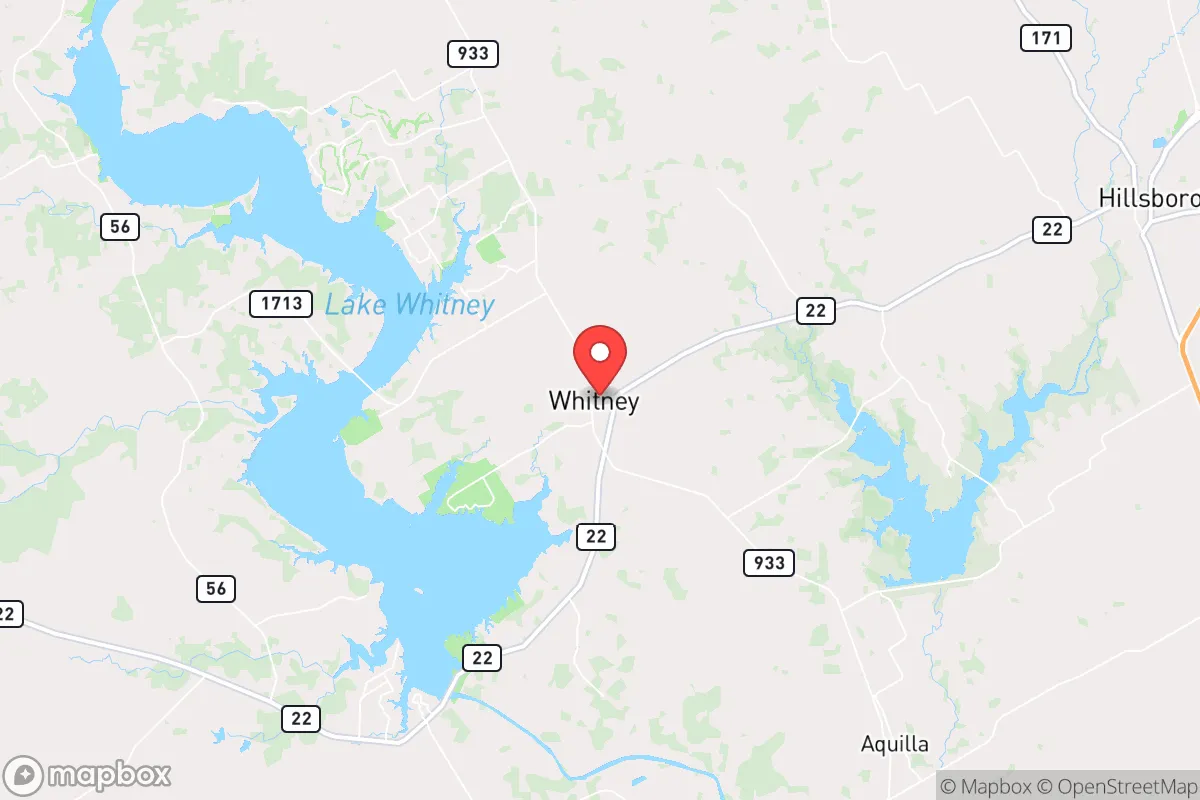
Demographics of Whitney, TX
Affluence Level in Whitney, TX
A middle-class area roughly in line with national averages across income, home values, education, and employment.
People of Whitney, TX
The people of Whitney, Texas today form a small, predominantly white community of 2,308 residents, with a notable Hispanic minority of 20.5% and a Black population of 6.6%. The city is characterized by a low college attainment rate of 9.2% and a foreign-born share of just 4.0%, reflecting a largely native-born, working-class population centered around Lake Whitney and local service industries. Distinctive identity markers include a strong hunting and fishing culture, a tight-knit rural character, and a population that skews older, with many retirees drawn to the lake lifestyle.
How the city was settled and grew
Whitney was founded in the late 19th century as a railroad town, incorporated in 1879 after the Missouri-Kansas-Texas Railroad extended its line through the area. The original settlers were primarily Anglo-American farmers and ranchers from the Deep South and Upper South, drawn by cheap land grants and the promise of cotton agriculture. The historic Downtown Whitney district, centered around the railroad depot on North San Jacinto Street, became the commercial and social hub for these early families. A second wave arrived in the 1910s and 1920s, when the discovery of oil in nearby Hill County brought a transient population of roughnecks and drillers, who settled in the Oil Field Addition neighborhood south of the railroad tracks. By the 1950s, the construction of Lake Whitney by the U.S. Army Corps of Engineers transformed the local economy, drawing a third wave of tourism-related workers and retirees who built homes in the Lake Whitney Estates area along the eastern shore.
Modern era (post-1965)
After the 1965 Hart-Cellar Act, Whitney saw minimal immigration-driven change, with the foreign-born share remaining below 5% through the present day. The major demographic shift came from domestic in-migration: white retirees and second-home buyers from the Dallas-Fort Worth metroplex, drawn by affordable lakefront property and a slower pace of life. These newcomers concentrated in the Whitney Harbor subdivision, a gated community with private boat slips built in the 1970s and 1980s. Meanwhile, the Hispanic population grew steadily from the 1990s onward, driven by labor demand in construction, landscaping, and hospitality around the lake. Hispanic families settled primarily in the West Whitney area, a less developed corridor along Farm-to-Market Road 933, where older mobile home parks and rental duplexes offered affordable entry points. The Black population, historically small and rooted in post-Reconstruction farming families, remains concentrated in the Southside Addition, a neighborhood established in the 1940s near the old cotton gin. Today, the city remains overwhelmingly white (67.6%), with East/Southeast Asian residents at 1.9% and no Indian-subcontinent population recorded, reflecting limited ethnic diversity beyond the Hispanic and Black communities.
The future
Whitney’s population is likely to continue its slow growth, driven by continued domestic in-migration from the Dallas-Fort Worth metroplex, particularly among retirees and remote workers seeking lower housing costs. The Hispanic share is expected to rise gradually, possibly reaching 25-30% by 2040, as younger Hispanic families replace aging white residents. However, the city shows no signs of tribalizing into distinct ethnic enclaves; instead, neighborhoods like Whitney Harbor and Lake Whitney Estates are likely to remain predominantly white and affluent, while West Whitney and Southside Addition will absorb most new Hispanic and Black residents. The foreign-born share will likely stay below 5%, as the city lacks the industrial or agricultural base to attract significant international immigration. The low college attainment rate (9.2%) suggests limited economic mobility, which may constrain population growth as younger residents leave for larger cities with better job opportunities.
Bottom-line: Whitney is becoming a quieter, older, and slightly more Hispanic version of its current self — a lake-oriented retirement and recreation community with a stable, native-born core. For someone moving in now, the city offers affordable housing and strong community ties, but limited ethnic diversity and few opportunities for upward mobility without a commute to Waco or Fort Worth.
* Values derived from national, state, county, city and local statistics and may differ in a specific area. Last updated: 2026-05-09T00:08:08.000Z
Narrative content on this page is AI-generated and may contain mistakes. Verify any details that matter before acting on them.
ReloMaps may earn a commission from affiliate links at no extra cost to you.