Photo: Wikipedia
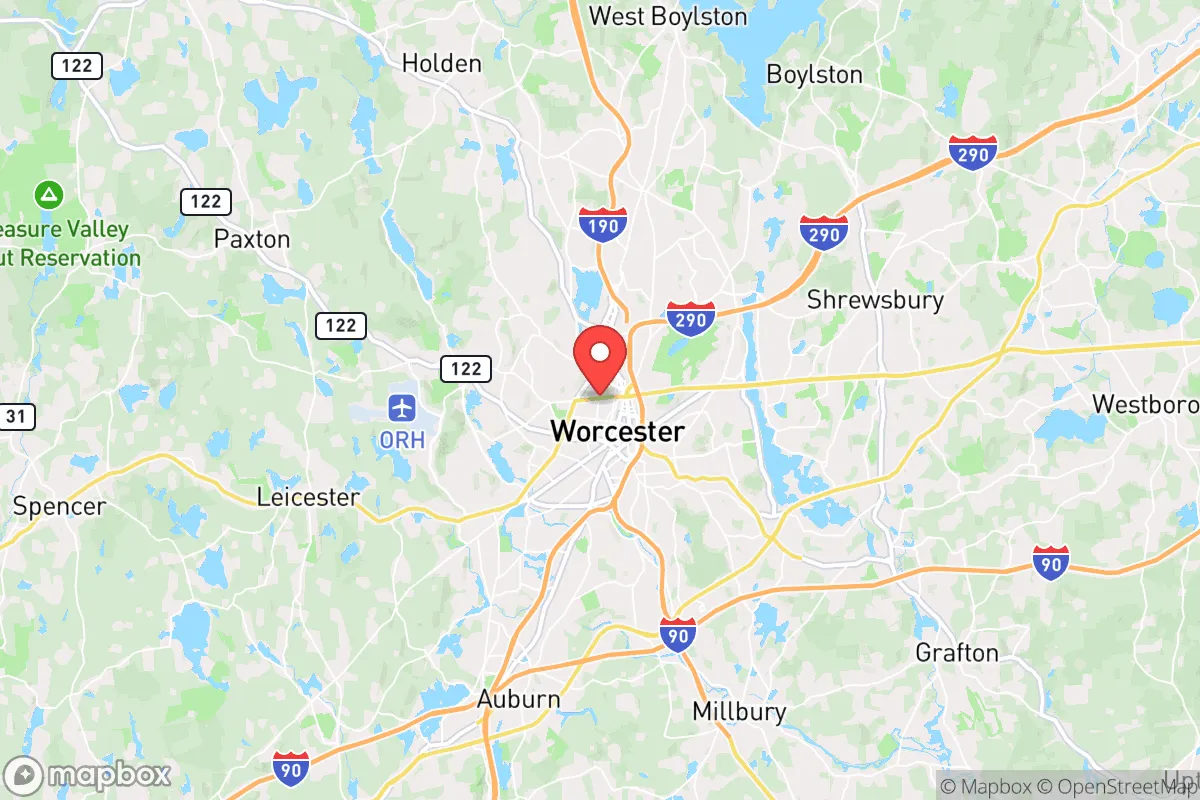
Demographics of Worcester, MA
Affluence Level in Worcester, MA
A middle-class area roughly in line with national averages across income, home values, education, and employment.
People of Worcester, MA
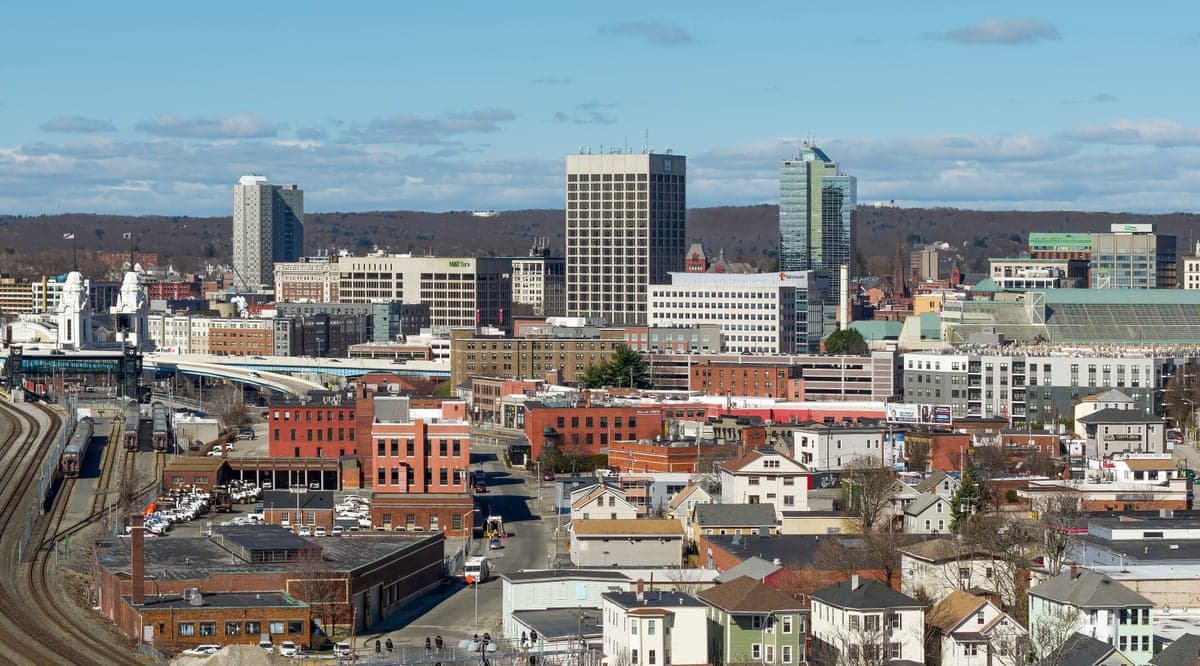
The people of Worcester, Massachusetts today form a dense, working-to-middle-class city of 205,501 residents, marked by a striking ethnic diversity that reflects over a century of industrial migration and post-1965 immigration. With a population that is 50.5% White, 24.9% Hispanic, 11.4% Black, 5.6% East/Southeast Asian, and 1.3% Indian (subcontinent), the city is a patchwork of distinct neighborhoods rather than a melting pot. Its identity is shaped by a strong Catholic and Orthodox Christian heritage, a resilient manufacturing and healthcare economy, and a growing college-educated cohort (34.1%) that coexists with a significant blue-collar base.
How the city was settled and grew
Worcester’s original European settlers were English Puritans who arrived in the 1670s, but the city’s explosive growth began with the Industrial Revolution. By the 1840s, the Blackstone Canal and later railroads turned Worcester into a manufacturing powerhouse, drawing massive waves of Irish immigrants fleeing the Great Famine. They settled in the Grafton Hill and Green Island neighborhoods, building St. John’s Catholic Church and forming the city’s first large ethnic bloc. French-Canadians followed in the 1860s-1880s, recruited for textile and shoe mills, and concentrated in Piedmont and Quinsigamond Village, where they established French-language parishes. Swedish immigrants arrived for the wire and tool industries, settling in Swede Hill (now part of the Main South area). By 1900, Worcester was a polyglot city of 118,000, with Italians and Polish immigrants arriving in the early 20th century, the former in Shrewsbury Street and the latter in Chandler Street and Burncoat. These groups built dense, walkable neighborhoods around parish churches and mutual-aid societies, creating a stable, family-oriented social fabric that persisted through the mid-20th century.
Modern era (post-1965)
The 1965 Hart-Celler Act reshaped Worcester’s demographics dramatically. The city’s White population peaked around 1970 at roughly 95% and has since declined to 50.5%, driven by suburban flight and the arrival of new immigrant groups. The most significant post-1965 wave has been Hispanic, primarily Puerto Rican and Dominican, who began arriving in the 1970s and 1980s for manufacturing and service jobs. They concentrated in Main South and Green Island, areas that had lost their earlier Irish and French-Canadian populations. Today, Main South is the city’s Hispanic heartland, with bodegas, Pentecostal churches, and a median age well below the city average. Black migration, largely from the American South and later from West Africa (especially Ghana and Liberia), grew steadily after 1980, settling in Great Brook Valley and parts of Bell Hill. East/Southeast Asian communities (Vietnamese, Chinese, Korean) arrived from the 1980s onward, often as refugees or through family reunification, and established a small but visible presence in Chandler Street and Lincoln Street corridors. The Indian (subcontinent) population, at 1.3%, is newer and smaller, concentrated among professionals in the medical and tech sectors near UMass Memorial Medical Center. Suburbanization has hollowed out some older ethnic enclaves: the Polish and Italian neighborhoods of Burncoat and Shrewsbury Street have become more mixed, while the city’s overall foreign-born share sits at 11.4%, below the national average but rising.
The future
Worcester’s population is trending toward greater diversity but also greater spatial segregation by ethnicity and income. The Hispanic share (24.9%) is the fastest-growing, driven by higher birth rates and continued migration, and is projected to approach 30-35% by 2040. This growth is concentrated in Main South and Green Island, creating a de facto Hispanic corridor that is increasingly distinct from the Whiter, more affluent western neighborhoods like Tatnuck and West Side. The East/Southeast Asian and Indian populations are growing slowly, primarily through professional in-migration, and are more dispersed. The Black population appears stable, with some second-generation families moving to suburbs like Shrewsbury and Auburn. The White population, while still a plurality, is aging and declining, with younger White families often choosing the suburbs or out-of-state metros. The city is not homogenizing; rather, it is tribalizing into ethnically distinct enclaves with limited cross-mixing. For a conservative-leaning mover, this means Worcester offers a genuine urban experience with strong neighborhood identities, but also the challenges of a school system (Worcester Public Schools, ~25,000 students) that is majority-minority and faces achievement gaps, and a property tax rate ($17.86 per $1,000 assessed value) that funds a growing municipal budget.
In sum, Worcester is becoming a majority-minority city with a resilient industrial core and a growing healthcare-education economy, but its neighborhoods remain defined by the ethnic waves that built them. For someone moving in now, the city offers affordable housing relative to Boston and a dense, walkable urban fabric, but the demographic future points to continued ethnic clustering rather than assimilation, with the Hispanic population driving most growth. The city’s character is best understood as a collection of distinct villages, each with its own history and trajectory, rather than a single unified community.
* Values derived from national, state, county, city and local statistics and may differ in a specific area. Last updated: 2026-05-01T21:34:17.000Z
Narrative content on this page is AI-generated and may contain mistakes. Verify any details that matter before acting on them.
ReloMaps may earn a commission from affiliate links at no extra cost to you.