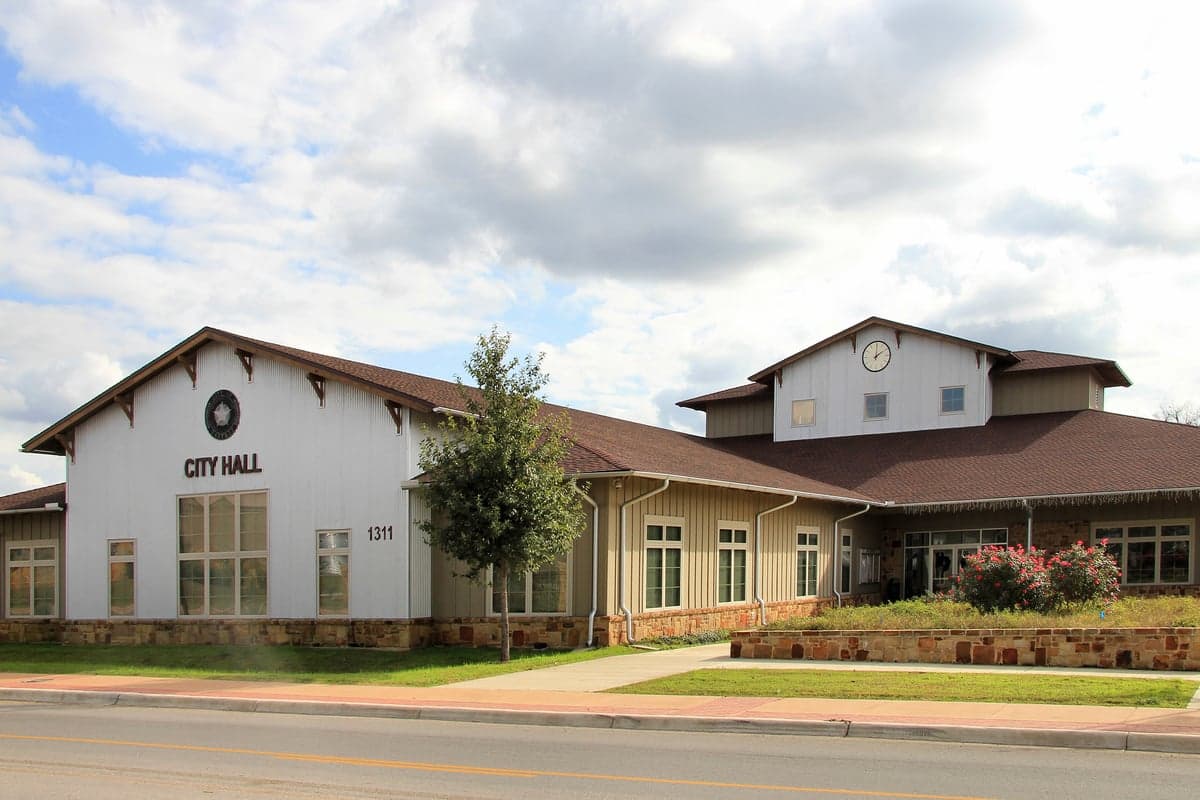
Photo: Wikipedia
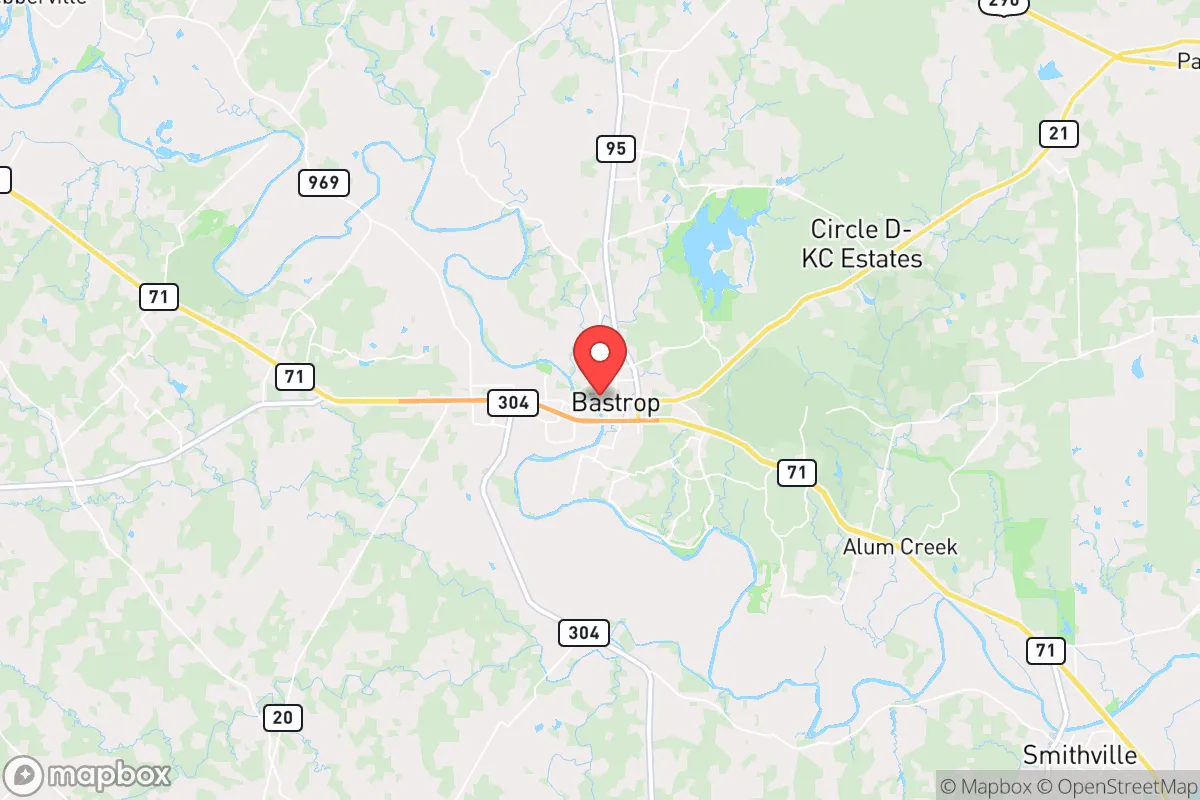
Demographics of Bastrop, TX
Affluence Level in Bastrop, TX
A middle-class area roughly in line with national averages across income, home values, education, and employment.
People of Bastrop, TX
Bastrop, Texas, today is a small city of 10,484 residents with a distinctly traditional, family-oriented character. Its population is predominantly White (57.3%) with a substantial Hispanic community (30.8%), a modest Black population (7.0%), and small but growing East/Southeast Asian (2.3%) and Indian subcontinent (0.3%) groups. The city’s identity is rooted in its role as the county seat of Bastrop County, blending historic preservation with a steady influx of families seeking affordable housing and a slower pace within commuting distance of Austin.
How the city was settled and grew
Bastrop’s human history begins with its founding in 1832 as Mina (renamed Bastrop in 1837), built on a land grant from the Mexican government to empresario Stephen F. Austin. The original settlers were primarily Anglo-American families from the Southern United States, drawn by cheap land and the promise of cotton farming along the Colorado River. These early arrivals established the Historic Downtown District, centered around the 1852 Bastrop County Courthouse, which remains the city’s core. By the late 19th century, German and Czech immigrants arrived, working as farmers and merchants, and settled in the Piney Creek area east of downtown, where their Lutheran churches and cemeteries still stand. The post-Civil War period saw a small but significant Black population form, largely descended from enslaved people freed after 1865, who built the Hillside neighborhood (also known as “The Bottoms”) along the river’s floodplain. This community established its own churches, schools, and businesses, including the historic St. John’s Baptist Church. Through the early 20th century, Bastrop remained a rural trade hub, with lumber from the Lost Pines forest and cotton driving the economy. The population grew slowly, reaching about 3,000 by 1950, with little ethnic change until the post-1965 era.
Modern era (post-1965)
The 1965 Hart-Cellar Immigration Act and the expansion of Austin’s tech economy after 1990 reshaped Bastrop’s demographics. The most significant shift was the growth of the Hispanic population, which rose from under 10% in 1970 to 30.8% today. This wave was driven by Mexican-American families moving from South Texas and Central America for construction, service, and agricultural work. They concentrated in the Southside neighborhood, south of State Highway 21, and in the Colony Park area near the Bastrop State Park entrance, where newer subdivisions like Tahitian Village also attracted Anglo retirees and commuters. The Black population, historically centered in Hillside, has remained stable at 7.0%, with some families moving to newer developments like Pine Forest in the city’s northwest. The East/Southeast Asian community (2.3%) is a recent arrival, primarily Vietnamese and Filipino professionals working in Austin’s healthcare and tech sectors, settling in the Lost Pines Estates subdivision near the Colorado River. The Indian subcontinent population (0.3%) is tiny but growing, with families drawn to the same Austin job market and choosing Bastrop for its lower housing costs. The city’s college-educated share (30.6%) reflects this influx of remote workers and professionals, though it remains below the Austin metro average.
The future
Bastrop’s population is heading toward greater diversity, but the pace is moderate. The Hispanic share is likely to continue rising, driven by both natural increase and continued migration from Central Texas’s expanding service economy, potentially reaching 35-40% by 2040. The White population, while still the majority, is aging and slowly declining as younger families move to newer suburbs like Elgin or Cedar Creek. The Black community is expected to remain stable, with some out-migration to larger cities balanced by new arrivals seeking affordable housing. East/Southeast Asian and Indian subcontinent populations will likely grow slowly, as Bastrop remains a secondary choice compared to Austin’s more established ethnic enclaves. The city is not tribalizing into distinct enclaves; instead, neighborhoods like Tahitian Village and Pine Forest are becoming more mixed, with Hispanic and Anglo families living side by side. The biggest demographic driver is the continued expansion of the Austin metro, which is pushing families and remote workers into Bastrop for its lower cost of living and historic charm.
For someone moving in now, Bastrop is becoming a more diverse but still predominantly White and Hispanic small city, with a stable, family-friendly character. The population is growing modestly (about 1-2% annually), and the city’s future depends on balancing new development with preservation of its historic core. It offers a conservative-leaning, community-oriented environment where newcomers can find affordable homes and a slower pace, but should expect gradual demographic change over the next decade.
* Values derived from national, state, county, city and local statistics and may differ in a specific area. Last updated: 2026-05-12T00:00:19.000Z
Narrative content on this page is AI-generated and may contain mistakes. Verify any details that matter before acting on them.
ReloMaps may earn a commission from affiliate links at no extra cost to you.