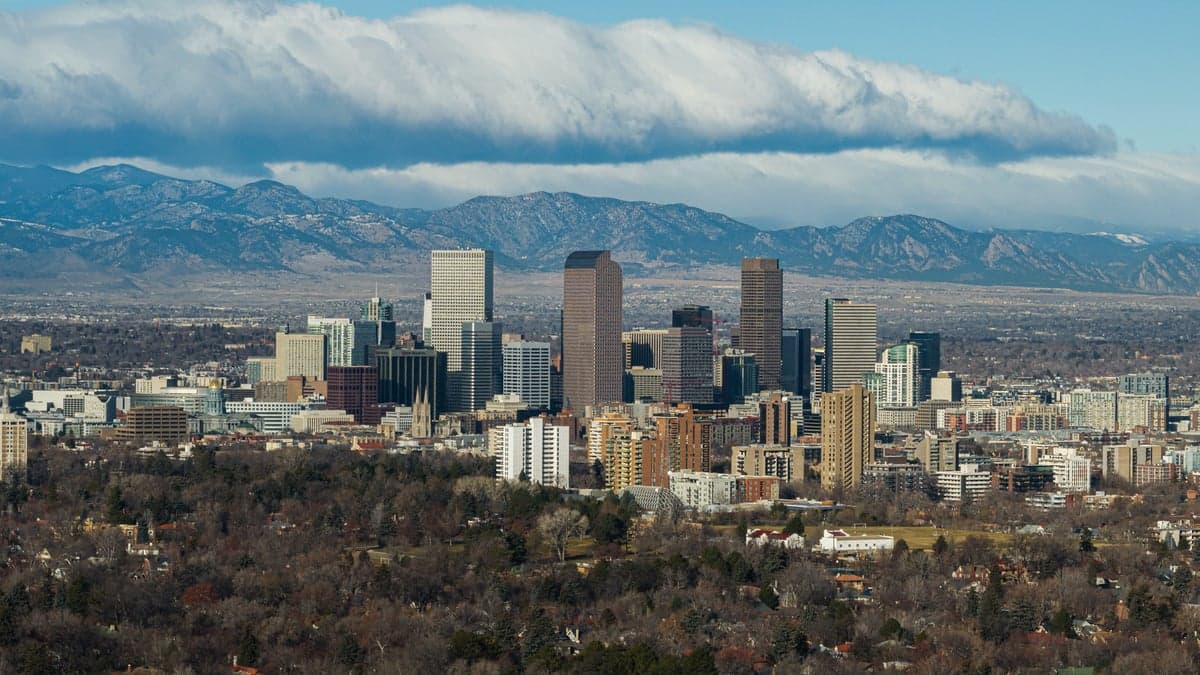

Photo: Wikipedia
Quality of Life in Denver, CO
Above-average quality of iife. The area offers a reasonable cost of living, decent mobility, and a mix of neighborhood amenities.
What does Quality of Life tell us?
Quality of Life blends cost of living, nearby amenities, socioeconomic signals, and neighborhood character. City-level scores represent the whole municipality; individual neighborhoods can differ.
What does this tell us?
Quality of Life blends cost of living, nearby amenities, socioeconomic signals, and neighborhood character. City-level scores represent the whole municipality; individual neighborhoods can differ.
Cost of Living
75% above national average
The Real Cost of Living in Denver, CO for 2026
| Tier | Individual | Family (4) |
|---|---|---|
| Survival | $28k | $53k |
| Comfortable | $114k | $168k |
| Luxury | $166k+ | $257k+ |
| Elite (Top 5%) | $221k+ | $343k+ |
55%
The Area Signal
A metric tracking the socioeconomic signals of the area.


Hobbies
Explore the areaGroceries
10 within 10 miles
Gas
20 within 10 miles
Hospital
3 within 20 miles
Airport
DEN — Denver International
Post Office
USPS — Denver, CO
Critical Amenities
Quality-of-Life Analysis
Denver, Colorado, attracts a predominantly young, educated, and active population, with a median age of 34.7 and over 40% of adults holding a bachelor’s degree or higher. The city’s cost of living index of 175 (100 = U.S. average) places it among the most expensive major metros in the Mountain West, drawing professionals in tech, healthcare, and renewable energy who prioritize outdoor access and urban amenities over low expenses. The result is a high-energy, transient community where incomes are above average—median household income hovers around $85,000—but housing costs consume a significant share of take-home pay.
Cost of living, housing affordability, and how Denver compares to Boulder and Colorado Springs
Denver’s cost of living is 75% above the national average, driven primarily by housing. The median home value sits at $586,700, roughly 2.5 times the national median, while median rent is $1,770 per month—about 30% higher than the U.S. average. Compared to nearby Boulder, where median home values exceed $900,000, Denver offers slightly more attainable pricing, but it remains significantly pricier than Colorado Springs, where the median home value is around $420,000. The average commute in Denver is 25.4 minutes, shorter than the national average of 27 minutes, thanks to a grid-like street layout and expanding RTD light rail system. However, affordability challenges are acute for renters: a household earning the area median income ($85,000) would spend roughly 25% of gross income on rent, but lower-income residents often pay over 40%, pushing many to suburbs like Aurora or Lakewood for cheaper options.
Everyday amenities, school quality, and the daily rhythm of life in Denver
Denver’s daily rhythm is defined by its 300 days of sunshine, a robust craft brewery scene (over 150 breweries in the metro), and a walkable downtown core anchored by the 16th Street Mall and Union Station. The city’s parks system is a standout: City Park, Washington Park, and Sloan’s Lake offer running trails, paddleboarding, and weekend farmers markets within a 10-minute drive for most residents. For families, Denver Public Schools (DPS) serve roughly 90,000 students, with top-rated options like Denver School of the Arts and East High School (consistently ranked in Colorado’s top 10). However, DPS faces equity gaps—test scores in low-income neighborhoods like Montbello lag behind affluent areas like Cherry Creek. Beyond school hours, the city’s cultural calendar is packed: the Denver Art Museum, Red Rocks Amphitheatre (a 20-minute drive), and the Colorado Rockies’ Coors Field provide year-round entertainment. Commuting patterns are car-dependent for most, though bike-share programs and the B, E, and W light rail lines serve key corridors like the I-25 and I-70 routes.
Denver is best suited for outdoor-oriented professionals and young families who can absorb the high housing costs in exchange for immediate access to hiking, skiing (within 90 minutes), and a vibrant social scene. Tech workers, remote employees, and healthcare professionals earning above $80,000 will find the trade-off manageable, while those on fixed incomes or with strict budgets may struggle. The city’s transient nature means newcomers can build social networks quickly through meetup groups, running clubs, and neighborhood block parties, but the lack of affordable starter homes and rising property taxes (averaging 0.55% of assessed value) are long-term concerns. For anyone prioritizing career growth, outdoor recreation, and a progressive urban environment, Denver delivers—but financial planning is essential to avoid being priced out.
Crime in Denver, CO
Significantly higher crime rates than 81% of comparable U.S. locations.
Violent CrimeViolent Crime Analysis
Property CrimeProperty Crime Analysis
Crime Analysis
Denver’s overall safety picture is a significant concern for potential residents, as the city’s crime rates substantially exceed both state and national averages. With a violent crime rate of 875.3 incidents per 100,000 residents and a property crime rate of 4,125.7 per 100,000, Denver ranks among the more dangerous large metro areas in the country. These figures reflect a broader trend seen in many progressive urban centers, where lenient justice policies have been linked to higher recidivism and reduced public safety.
Crime in context
Denver’s violent crime rate is more than double the national average of roughly 380 per 100,000, while its property crime rate is nearly triple the U.S. figure of about 1,950 per 100,000. Compared to the state of Colorado, which reports a violent crime rate of approximately 480 per 100,000, Denver is a clear outlier. The city’s elevated crime numbers are often attributed to the progressive policies of local district attorneys and judges, who prioritize diversion programs and reduced sentencing over incarceration. This approach, while sympathetic to offenders, has resulted in more criminals remaining on the streets, directly undermining justice for victims and the general public. Neighboring suburban jurisdictions with more conservative prosecutorial philosophies, such as Douglas County, report far lower crime rates, underscoring the impact of local justice system ideology.
What residents experience
For those living in Denver, property crime is the most pervasive issue. Car thefts, package thefts, and burglaries are common, with many residents reporting multiple incidents over a few years. Violent crime, while less frequent, is concentrated in specific areas and often involves disputes among individuals known to each other. The city’s homeless population, which has grown under supportive local policies, is also associated with increased property crime and public disorder in downtown and transit corridors. Residents frequently express frustration with a justice system that appears to prioritize offender rehabilitation over victim protection, leading to a sense of impunity among repeat offenders.
Neighborhood-level variation
Safety in Denver varies dramatically by neighborhood. Areas like Capitol Hill, Five Points, and parts of downtown experience the highest rates of both violent and property crime, driven by density, nightlife, and transient populations. In contrast, neighborhoods such as Washington Park, Hilltop, and Cherry Creek are significantly safer, with crime rates closer to the national average. Suburban communities like Aurora and Lakewood, which share Denver’s metro area but have their own law enforcement and prosecutorial approaches, also show mixed results. For those considering a move, prioritizing neighborhoods with strong community policing and less progressive justice policies is essential for minimizing risk.
* Values derived from national, state, county, city and local statistics and may differ in a specific area. Last updated: 2026-04-20T08:04:19.000Z
Narrative content on this page is AI-generated and may contain mistakes. Verify any details that matter before acting on them.
ReloMaps may earn a commission from affiliate links at no extra cost to you.