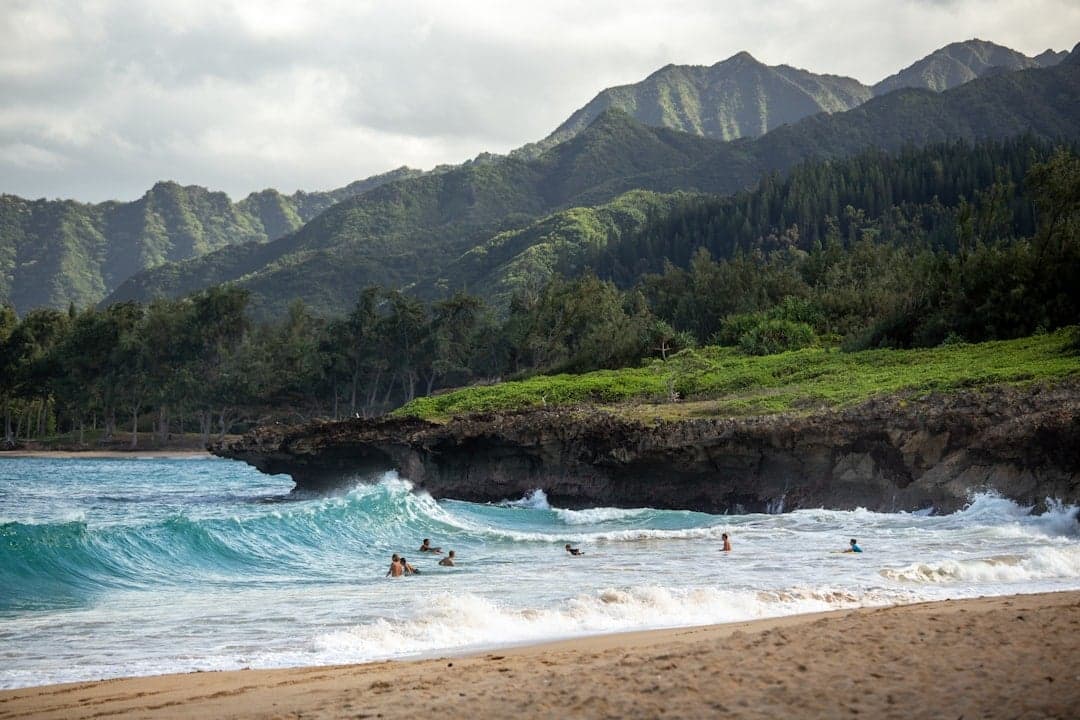
Photo: Luke McKeown via Unsplash
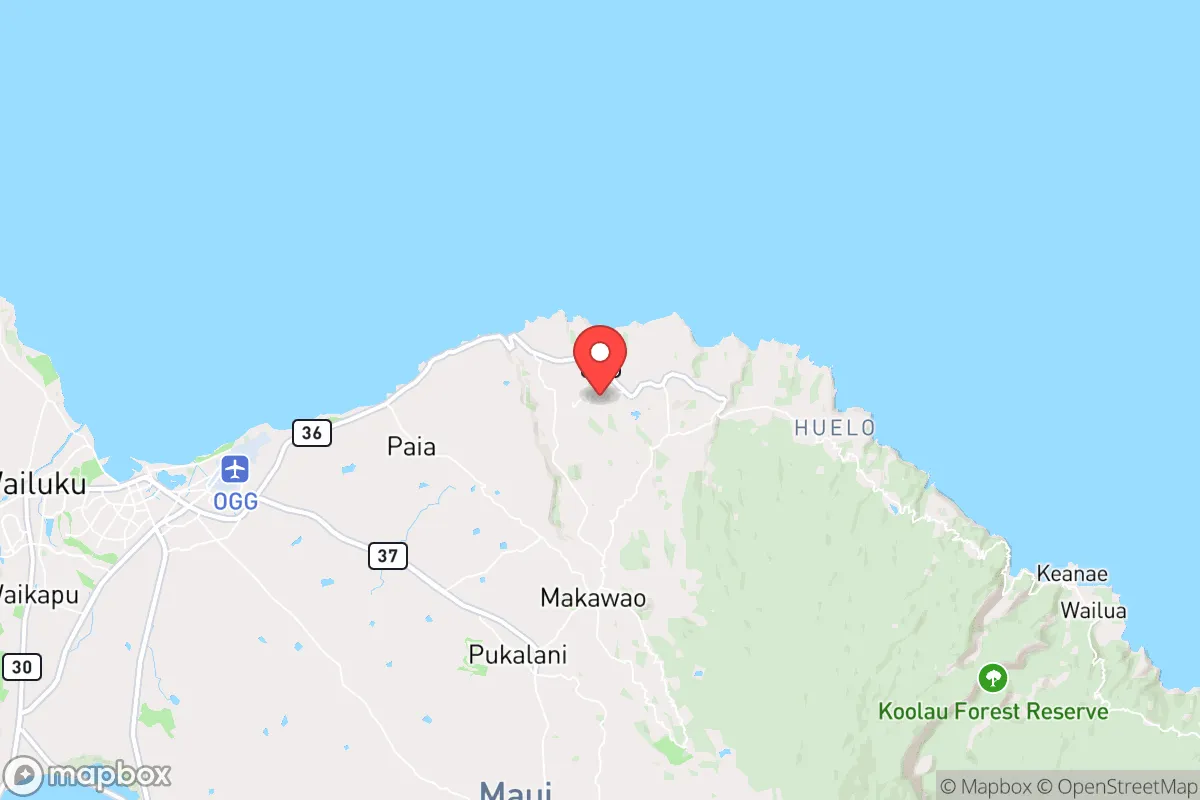
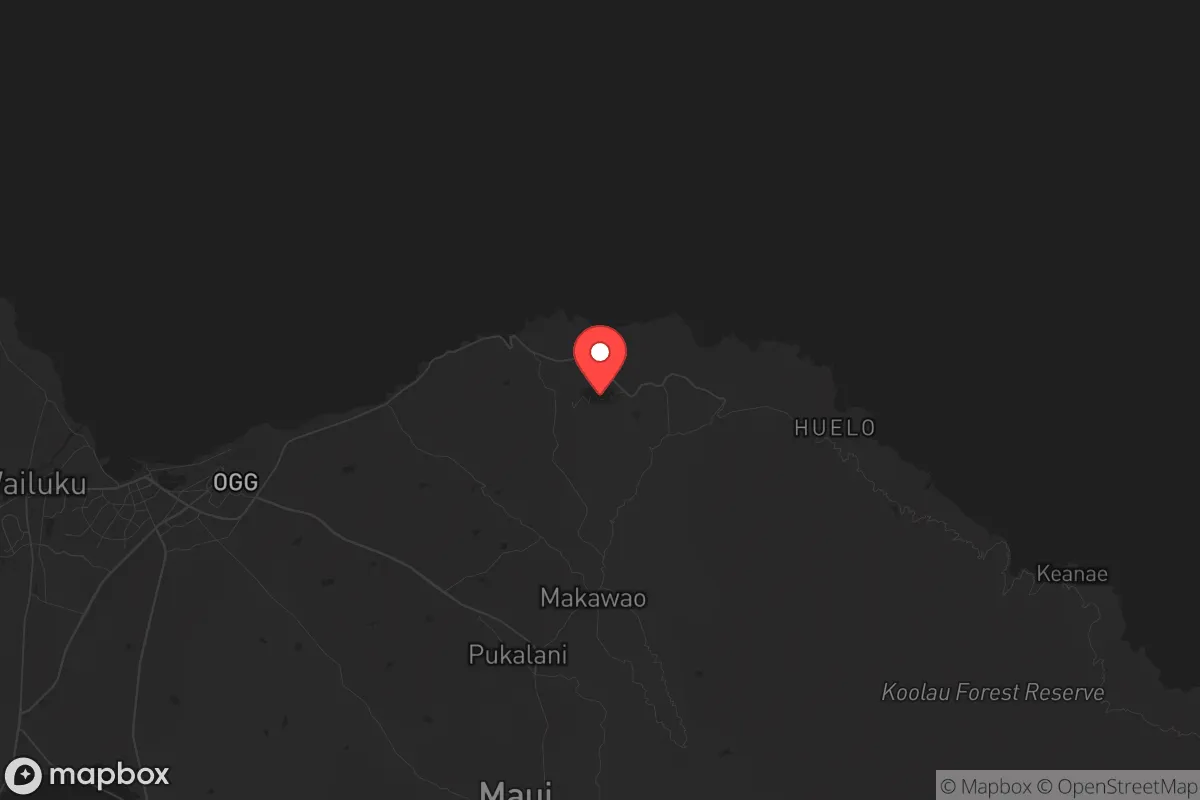
Demographics of Haiku Pauwela, HI
Historical data isn't available for Haiku Pauwela, HI. Trends shown are for Maui County, Hawaii.
Affluence Level in Haiku Pauwela, HI
An upper-middle-class area. Household wealth, education levels, and homeownership run ahead of national benchmarks.
People of Haiku Pauwela, HI
The people of Haiku Pauwela today form a small, predominantly White community of 3,690 residents, marked by a distinctly rural character and a higher-than-average share of families. With a foreign-born population of just 4.3%, the area is overwhelmingly native-born, and its largest minority groups are Hispanic residents at 12.7% and East/Southeast Asian communities at 11.8%. The population is notably less diverse than the broader Maui County, with a Black population of 0.0% and no measurable Indian subcontinent presence, giving the area a quiet, homogeneous feel that appeals to those seeking seclusion and a slower pace of life.
How the city was settled and grew
Haiku Pauwela’s settlement history is rooted in the plantation era of the late 19th and early 20th centuries. The area was originally part of the vast sugar cane plantations that dominated Maui’s north shore. The first major wave of population came with the establishment of the Haiku Sugar Company in the 1860s, which drew a workforce of Native Hawaiians and later immigrants from East Asia, particularly Japanese and Chinese laborers. These workers built small camps and settlements in what are now the Haiku Homesteads and Pauwela districts, where remnants of plantation housing and community halls still stand. The plantation economy remained the backbone of the local population through the 1940s, with the population peaking during the sugar boom years before mechanization reduced labor needs. By mid-century, the closure of the Haiku Sugar Mill in 1946 triggered a gradual depopulation, as many families moved to larger towns like Kahului for work.
Modern era (post-1965)
The post-1965 era brought a slow but significant demographic shift. The 1970s and 1980s saw an influx of mainland Americans, particularly from California and the Pacific Northwest, drawn by affordable land and the promise of a rural Hawaiian lifestyle. These new residents—predominantly White and often with some college education—settled in the Haiku Uka and Makawao Forest Reserve fringes, building single-family homes on large lots. This wave transformed the area’s character from a declining plantation village to a bedroom community for professionals working in Kahului and Wailuku. The Hispanic population, now 12.7%, began growing in the 1990s as families moved from the mainland and other parts of Maui for service-sector jobs in hospitality and construction, clustering in the Lower Haiku area near the main highway. The East/Southeast Asian share (11.8%) is largely composed of Japanese-American families with deep roots in the plantation era, many of whom remain in the Pauwela district, alongside a smaller number of Filipino residents who arrived in the 2000s. The White population, at 44.8%, is the largest group, concentrated in the more elevated, scenic parts of the census-designated place, particularly around Haiku Road and the Pauwela Point area.
The future
Looking ahead, Haiku Pauwela’s population is likely to remain small and stable, with slow growth constrained by limited housing stock and strict county zoning that favors large lots. The area is not homogenizing into a single enclave but rather tribalizing into distinct geographic clusters: White mainland transplants in the higher elevations, Hispanic families in the lower corridor, and East/Southeast Asian families in the historic plantation core. The foreign-born share (4.3%) is unlikely to rise significantly, as the area lacks the rental housing and job density that attract new immigrants. The college-educated share (29.2%) may increase slightly as remote work draws more professionals, but the high cost of land—often over $1 million for a buildable lot—will limit in-migration to wealthier buyers. The next decade will likely see a continuation of the current trend: a quiet, predominantly White and native-born population, with modest growth from domestic migration rather than international arrivals.
For someone moving in now, Haiku Pauwela offers a stable, low-density community with a strong sense of place and minimal demographic churn. It is not a place of rapid change or cultural mixing, but rather a settled, rural enclave where property values and a quiet lifestyle are the primary draws. The area’s future is one of preservation rather than transformation, making it best suited for those who value consistency and seclusion over diversity and urban amenities.
* Values derived from national, state, county, city and local statistics and may differ in a specific area. Last updated: 2026-04-24T11:44:31.000Z
Narrative content on this page is AI-generated and may contain mistakes. Verify any details that matter before acting on them.
ReloMaps may earn a commission from affiliate links at no extra cost to you.