Photo: Wikipedia
Quality of Life in Happy Valley, OR
A high quality of life with strong walkability, manageable living costs, healthy neighborhood signals, and solid amenity access.
What does Quality of Life tell us?
Quality of Life blends cost of living, nearby amenities, socioeconomic signals, and neighborhood character. City-level scores represent the whole municipality; individual neighborhoods can differ.
What does this tell us?
Quality of Life blends cost of living, nearby amenities, socioeconomic signals, and neighborhood character. City-level scores represent the whole municipality; individual neighborhoods can differ.
Cost of Living
100% above national average
The Real Cost of Living in Happy Valley, OR for 2026
| Tier | Individual | Family (4) |
|---|---|---|
| Survival | $32k | $61k |
| Comfortable | $131k | $192k |
| Luxury | $210k+ | $325k+ |
| Elite (Top 5%) | $247k+ | $383k+ |
63%
The Area Signal
A metric tracking the socioeconomic signals of the area.
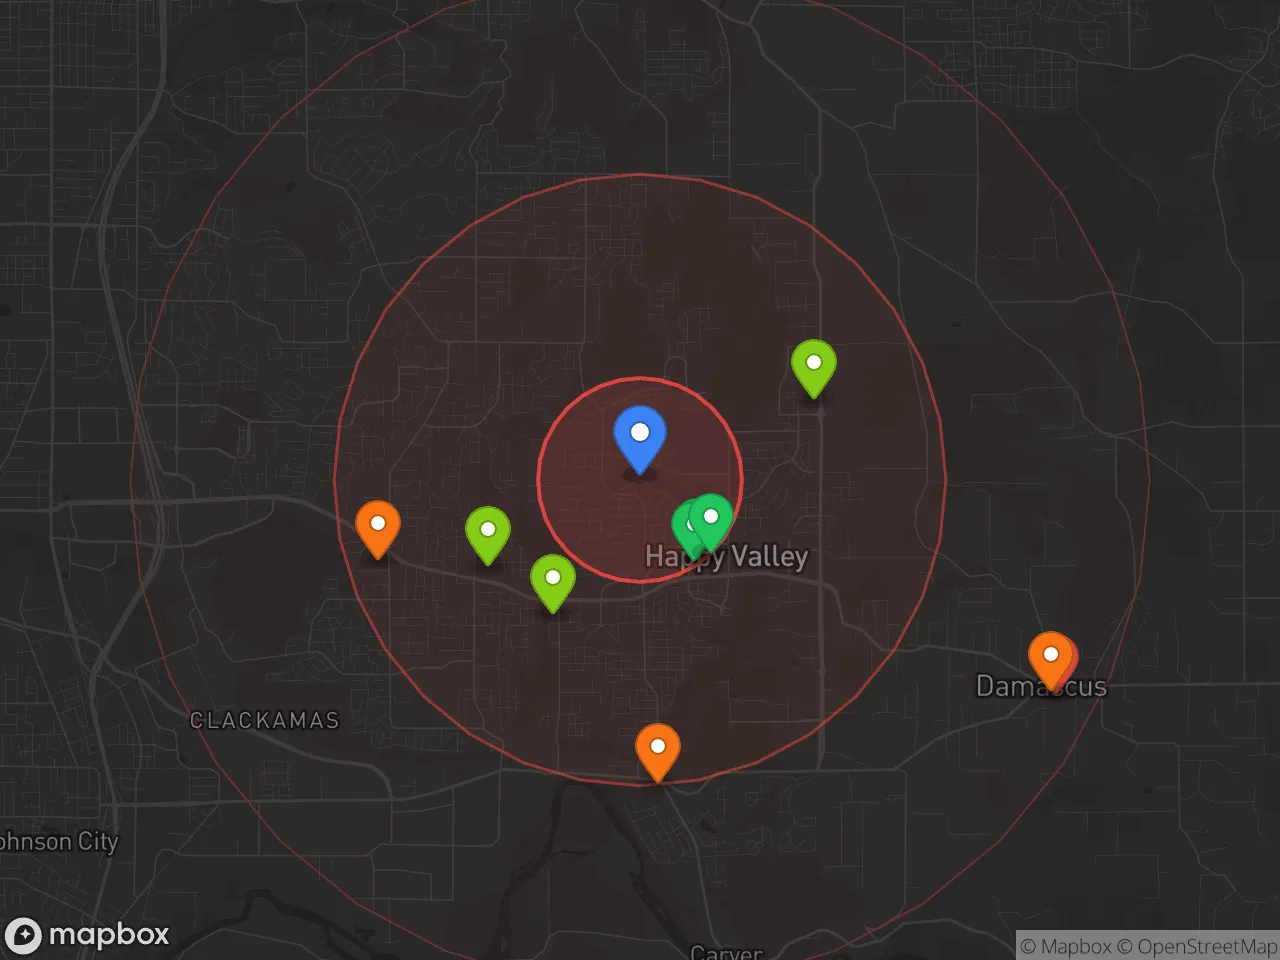
Hobbies
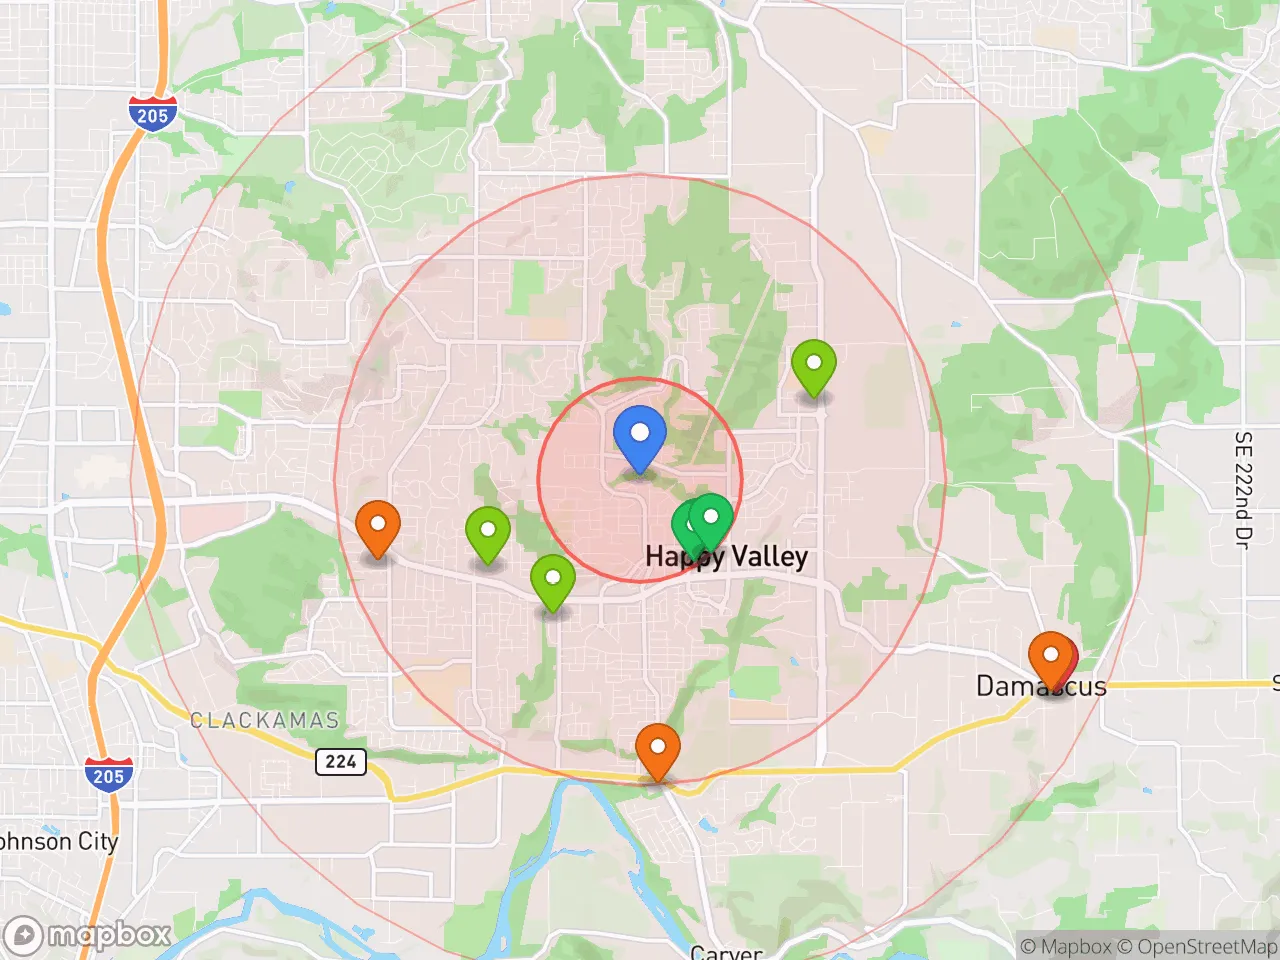
Explore the areaGroceries
8 within 10 miles
Gas
20 within 10 miles
Hospital
20 within 20 miles
Airport
PDX — Portland International
Post Office
USPS — 9009 Southeast Adams Street, Clackamas
Critical Amenities
Quality-of-Life Analysis
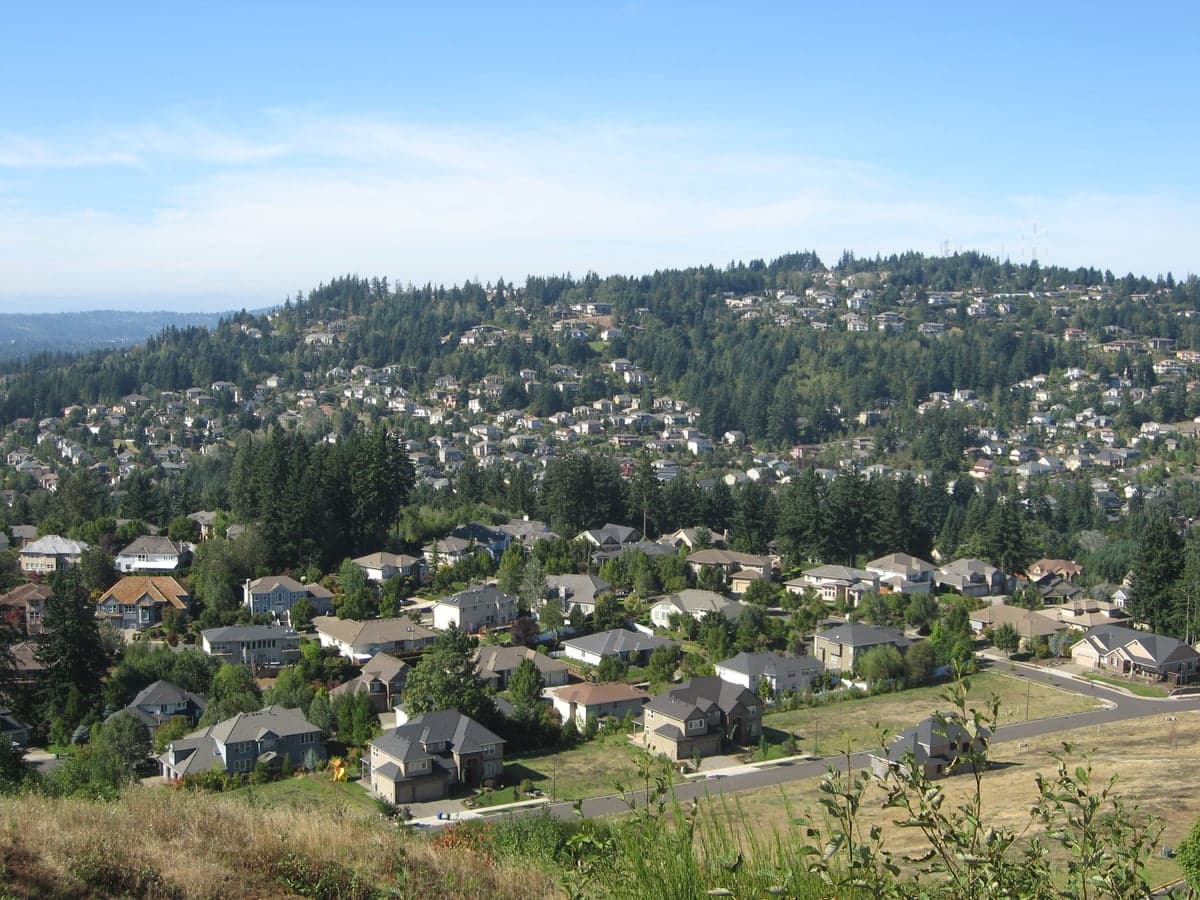
Happy Valley, Oregon, is one of the most affluent communities in the Portland metropolitan area, with a cost of living index of 200 (double the U.S. average) that reflects its concentration of upper-middle-class professionals, executives, and families seeking large new-construction homes and top-rated schools. The city’s rapid growth since the 2000s has attracted residents who prioritize suburban space, low crime rates, and proximity to Portland’s job centers, creating a demographic profile dominated by married couples with children and a median household income well above the state average.
Cost of living, housing prices, and affordability compared to Portland and Clackamas County
Happy Valley’s cost of living is the highest in Clackamas County, driven almost entirely by housing. The median home value sits at $671,800, roughly 60% higher than the Portland metro median and more than double the Oregon state median. Median rent is $2,025, which, while high, is only slightly above the metro average because the rental market is smaller and dominated by newer apartment complexes. The average commute of 28.1 minutes is slightly longer than the metro average, reflecting the fact that many residents drive to jobs in downtown Portland (about 12 miles northwest) or to tech and manufacturing hubs in Hillsboro and Beaverton. For buyers, the trade-off is clear: you pay a premium for large lots, newer construction (most homes built after 2000), and a school district that consistently ranks among Oregon’s best. Renters face less of a premium but still pay above-market rates for units in communities like the Happy Valley Town Center or near Mount Scott.
What daily life is like for families: schools, parks, and local amenities
Daily life in Happy Valley revolves around the North Clackamas School District, which includes the highly rated Adrienne C. Nelson High School and Happy Valley Middle School. The city’s planning emphasizes green space: the 1,100-acre Happy Valley Park offers sports fields, a dog park, and a seasonal farmers market, while the nearby Mount Talbert Nature Park provides hiking trails with views of Mount Hood. Retail and dining are concentrated at the Happy Valley Town Center, anchored by a New Seasons Market and a mix of chain and local restaurants. The city lacks a traditional downtown core, so most errands require a car, but the layout is pedestrian-friendly within individual neighborhoods. Commuters rely on I-205 and OR-213, with TriMet bus service providing limited connections to the Portland MAX light rail at the Clackamas Town Center Transit Center. The overall rhythm is quiet and family-oriented, with weekend activities centered on youth sports leagues, school events, and outdoor recreation at nearby Clackamas River or Mount Hood National Forest.
Happy Valley is best suited for families and professionals who can afford the housing premium and value top-tier schools, low crime, and suburban space over urban walkability or nightlife. Empty nesters downsizing from larger Portland-area homes also find appeal in the newer patio-home developments. Singles and renters on a median income will likely find the cost prohibitive unless they are willing to commute from more affordable neighboring cities like Gresham or Oregon City. For those who fit the financial profile, Happy Valley offers a stable, amenity-rich environment with strong property values and a community feel that remains rare in the Portland suburbs.
Crime in Happy Valley, OR
Crime rates similar to the national median for U.S. locations.
Violent CrimeViolent Crime Analysis
Property CrimeProperty Crime Analysis
Crime Analysis
Happy Valley, Oregon, presents a complex safety profile that demands careful scrutiny. While often marketed as a desirable suburb of Portland, the city's violent crime rate of 306.9 incidents per 100,000 residents and property crime rate of 2,110.8 per 100,000 place it in a concerning middle ground—significantly safer than Portland proper but notably riskier than many comparable suburban communities in Clackamas County. These figures, combined with the broader regional context of progressive criminal justice policies, warrant a cautious assessment for potential residents.
Crime in context
Happy Valley's violent crime rate sits roughly 15% below the national average but is elevated compared to other affluent Portland suburbs like Lake Oswego or West Linn. Property crime, however, tells a more troubling story: the rate exceeds the national average by approximately 10% and is nearly double that of neighboring Damascus. This disparity reflects a pattern seen across the Portland metropolitan area, where property offenses—particularly vehicle break-ins and package thefts—have surged since 2020. The city's proximity to Portland means it is not insulated from the spillover effects of that city's well-documented struggles with property crime and a justice system that, under progressive leadership, has prioritized diversion programs and reduced incarceration for non-violent offenses. For context, Clackamas County's overall crime rate is roughly 2,500 per 100,000, meaning Happy Valley's property crime alone accounts for the bulk of that figure.
What residents experience
Daily life in Happy Valley involves a heightened awareness of property crime. Residents commonly report porch piracy, unlocked vehicle entries, and occasional garage burglaries as routine annoyances. Violent crime is less frequent but not absent: the city recorded zero homicides in 2024, yet aggravated assaults and robberies do occur, often connected to retail areas along SE 82nd Avenue and the Happy Valley Town Center. The Clackamas County District Attorney's office, while less progressive than Multnomah County's, has still adopted policies that decline to prosecute certain low-level property crimes—a factor that emboldens repeat offenders. Residents describe a community where neighbors watch out for each other, but where police response times can lag during peak hours due to the city's relatively small force of about 30 sworn officers covering 11 square miles.
Neighborhood-level variation is significant. Gated communities and newer developments east of I-205, such as those in the Mount Scott and Carus areas, report far fewer incidents than older subdivisions closer to the Portland border. The Happy Valley Park and Summit Ridge neighborhoods see the lowest crime rates, while areas near the Clackamas Town Center retail corridor experience more property crime. Prospective residents should prioritize homes with off-street parking, security systems, and neighborhood watch participation. Overall, Happy Valley offers a suburban safety buffer from Portland's worst crime trends, but the influence of regional progressive justice policies means that property crime remains a persistent concern that requires active mitigation by residents and local law enforcement.
* Values derived from national, state, county, city and local statistics and may differ in a specific area. Last updated: 2026-05-03T10:47:54.000Z
Narrative content on this page is AI-generated and may contain mistakes. Verify any details that matter before acting on them.
ReloMaps may earn a commission from affiliate links at no extra cost to you.