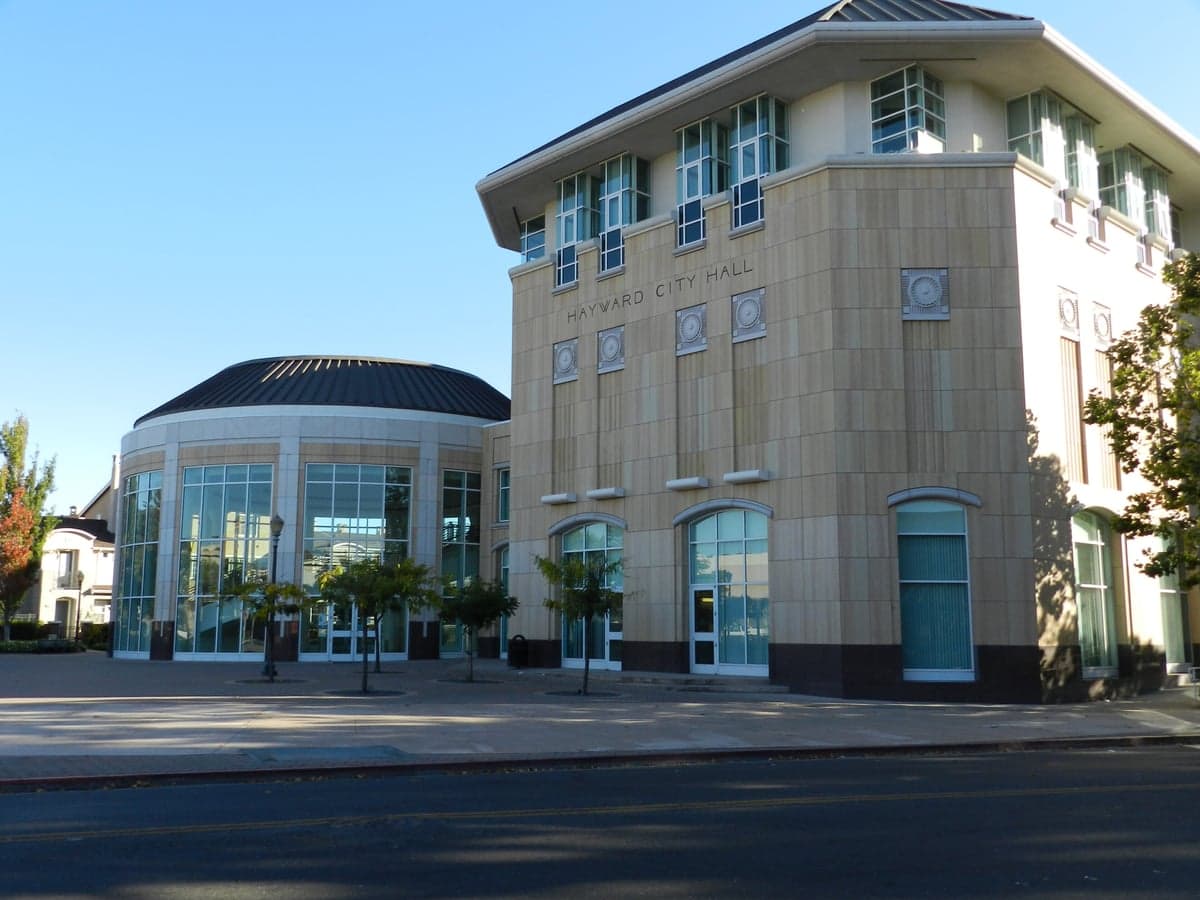
Photo: Wikipedia
Demographics of Hayward, CA
Affluence Level in Hayward, CA
An upper-middle-class area. Household wealth, education levels, and homeownership run ahead of national benchmarks.
People of Hayward, CA
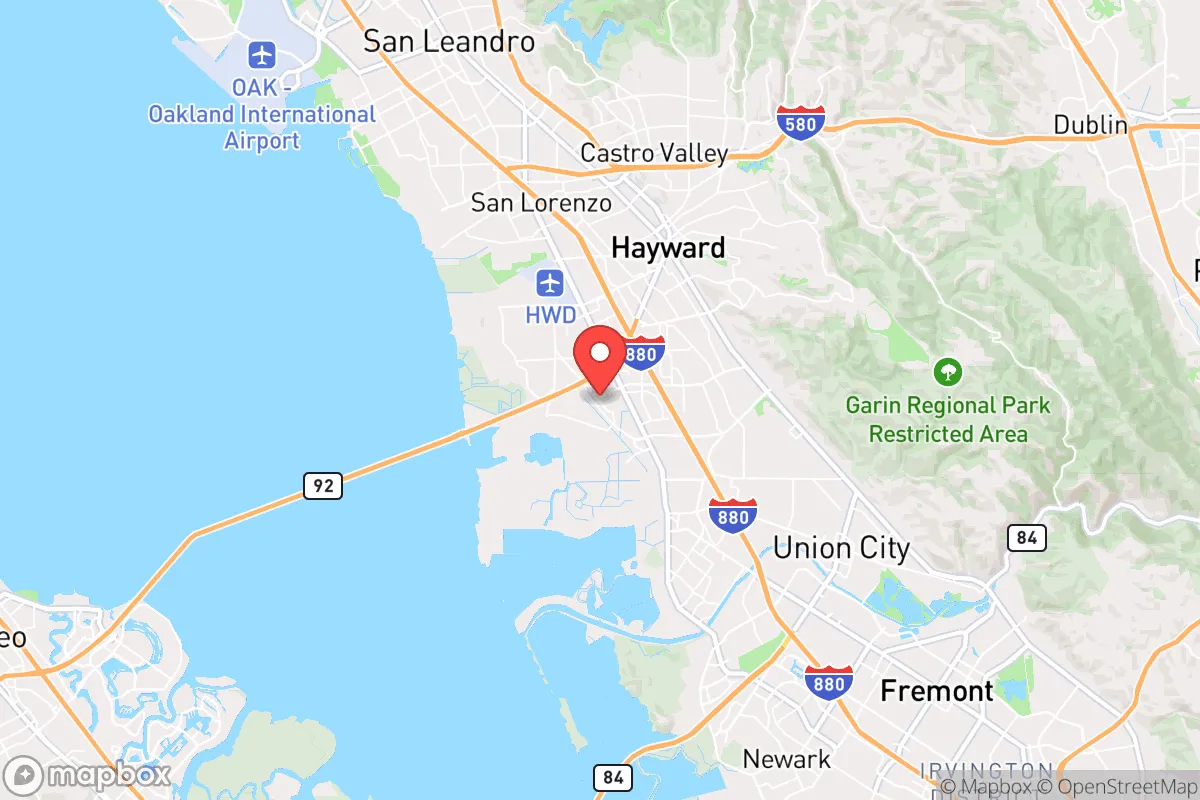
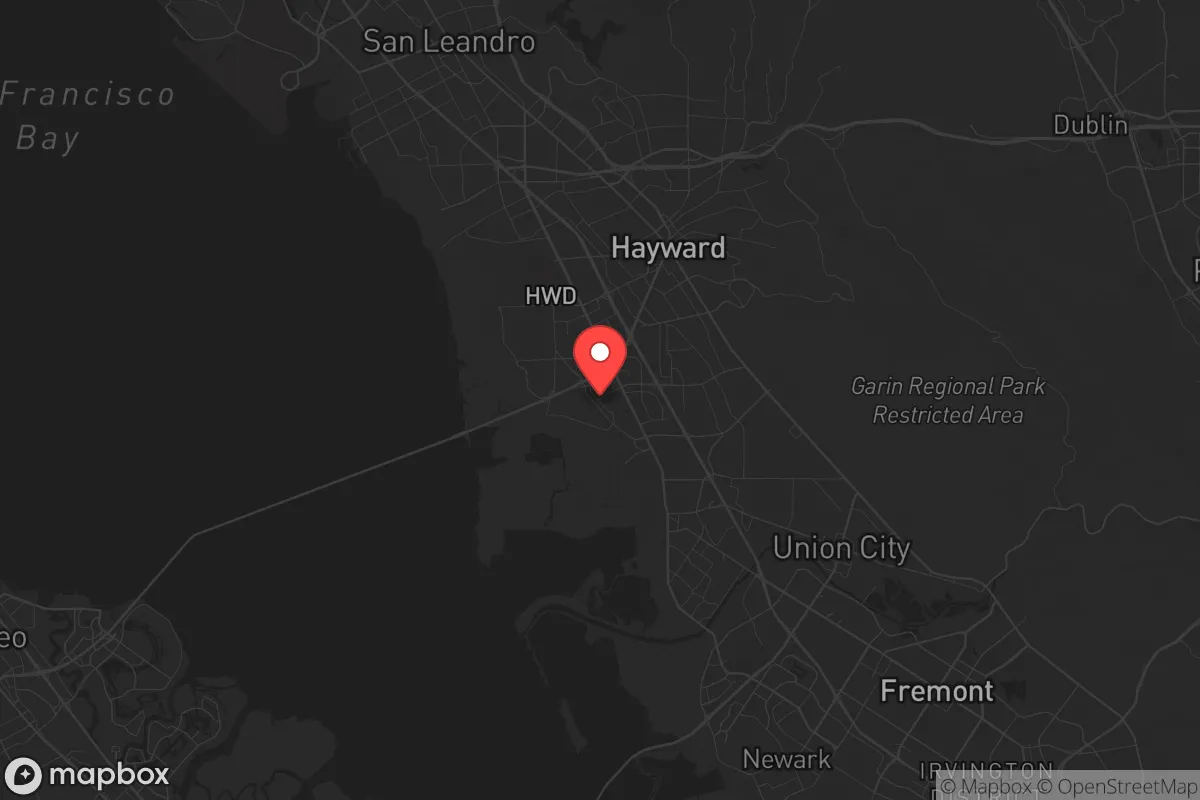
Hayward, California, is a dense, working-class East Bay city of 159,201 residents defined by its extraordinary ethnic diversity and a pronounced middle-skill, blue-collar character. Unlike many Bay Area suburbs, it is majority-minority with a large Hispanic plurality (40.9%) and a substantial East/Southeast Asian population (24.4%), alongside a smaller but notable Indian-subcontinent community (4.7%) and a Black population (8.7%) that is larger than the state average. The city feels less like a bedroom suburb and more like a self-contained urban center, with a gritty, unpretentious identity shaped by waves of immigrant labor and domestic migration.
How the city was settled and grew
Hayward’s population history begins not with Spanish missions but with the 1860s arrival of the transcontinental railroad, which turned the area into a shipping hub for local agriculture. The original settlers were a mix of Yankee farmers and European immigrants—Portuguese, Italian, and German families—who built the early core around what is now Downtown Hayward and the Harder-Tennyson neighborhood. The 1906 San Francisco earthquake drove a wave of displaced residents eastward, and by the 1920s, Hayward was a modest farm town of about 5,000 people. The real transformation came during World War II, when the nearby Naval Air Station Alameda and shipyards in Oakland drew tens of thousands of workers. This period saw the first large influx of Black families from the South and white migrants from the Dust Bowl, who settled in working-class tracts like South Hayward and the Jackson Triangle. The post-war boom of the 1950s and 1960s added tract homes and a growing industrial base—especially food processing and auto manufacturing—that cemented Hayward’s identity as a blue-collar hub.
Modern era (post-1965)
The 1965 Hart-Cellar Act fundamentally reshaped Hayward’s population. The city’s existing industrial jobs and relatively affordable housing drew a massive wave of immigrants from Asia and Latin America. Filipino and Chinese families arrived first in the 1970s, clustering in Mission Boulevard corridors and the Glen Eden neighborhood, followed by Vietnamese and Cambodian refugees in the 1980s. Simultaneously, Mexican and Central American immigrants moved into South Hayward and the area around Industrial Parkway, working in warehouses, construction, and food service. By 1990, Hayward had shifted from a majority-white city to one where no single ethnic group held a majority. The white population, which was over 70% in 1970, has since fallen to just 13.1%. The Black population, which peaked at around 15% in the 1990s, has declined slightly as some families moved to more affordable inland suburbs. The East/Southeast Asian share (24.4%) is concentrated in the central and northern parts of the city, while the Hispanic population (40.9%) is dominant in the south and along the Mission Boulevard corridor. The Indian-subcontinent community (4.7%) is a more recent arrival, growing since the 2000s, and is most visible in the Upper B Street area and near California State University, East Bay.
The future
Hayward’s population is not homogenizing; it is tribalizing into distinct ethnic enclaves that are becoming more entrenched. The Hispanic share is growing steadily—up from about 34% in 2010—driven by both immigration and higher birth rates, while the white share continues to shrink. The East/Southeast Asian population appears stable, with younger generations often leaving for suburbs like Dublin or Pleasanton. The Indian-subcontinent community is the fastest-growing segment, though it remains small in absolute numbers. The city’s overall growth is slow—population has been flat since 2020—constrained by high housing costs and limited new construction. Over the next 10–20 years, Hayward will likely become more Hispanic and more Indian, while the Black and East/Southeast Asian shares plateau or decline slightly. The city is also aging: the median age is 37, and the college-educated share (32.6%) is below the Bay Area average, suggesting that Hayward is not attracting the tech-driven, high-income migration that is reshaping nearby cities like Fremont.
For a conservative-leaning newcomer, Hayward offers a pragmatic, family-oriented environment with strong ethnic community ties and a no-nonsense working-class ethos. It is not a place of rapid gentrification or cultural upheaval—rather, it is a stable, blue-collar city where neighborhoods remain distinct and where the cost of living, while high by national standards, is among the more attainable in the Bay Area. The bottom line: Hayward is becoming a denser, more Hispanic, and more Indian city, but its character as a hardworking, immigrant-driven community is unlikely to change.
* Values derived from national, state, county, city and local statistics and may differ in a specific area. Last updated: 2026-04-24T12:20:46.000Z
Narrative content on this page is AI-generated and may contain mistakes. Verify any details that matter before acting on them.
ReloMaps may earn a commission from affiliate links at no extra cost to you.