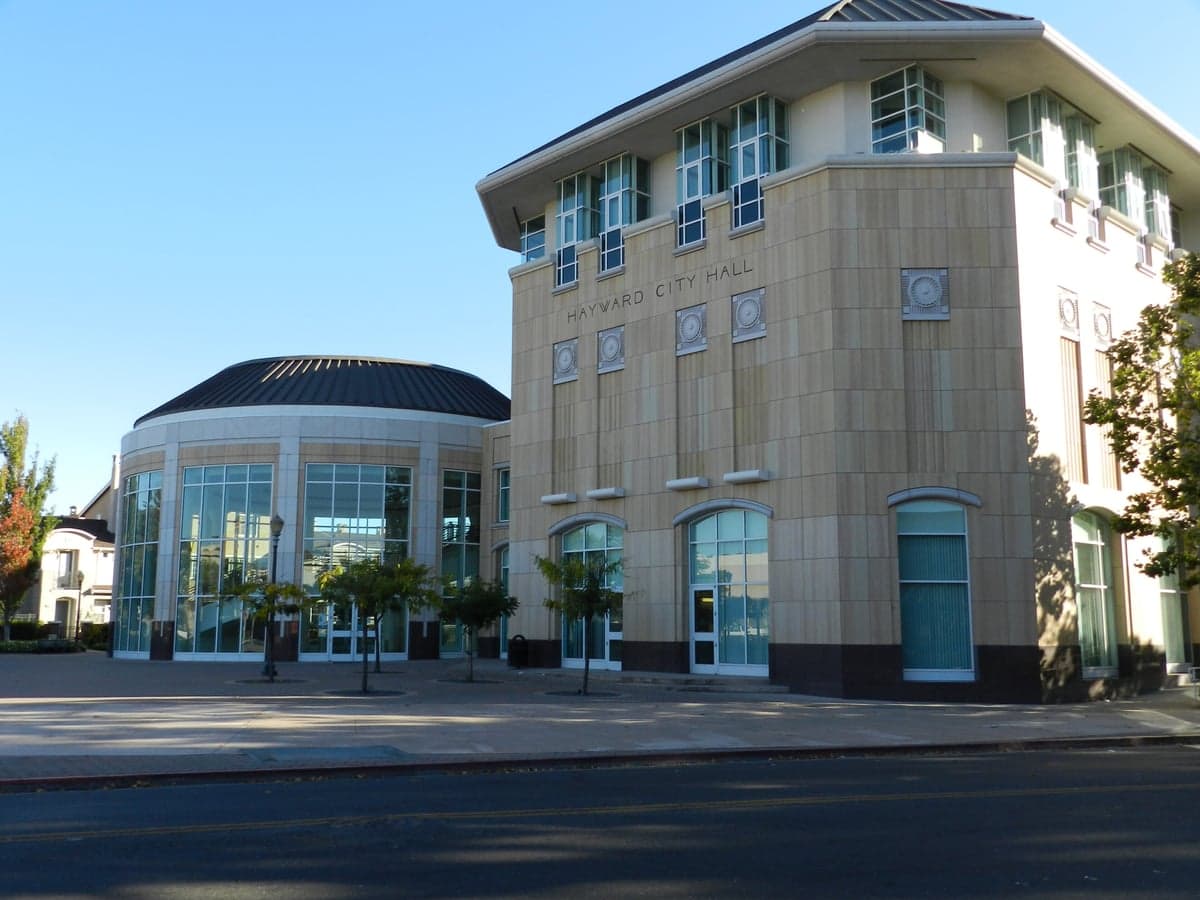
Photo: Wikipedia
Quality of Life in Hayward, CA
A high quality of life with strong walkability, manageable living costs, healthy neighborhood signals, and solid amenity access.
What does Quality of Life tell us?
Quality of Life blends cost of living, nearby amenities, socioeconomic signals, and neighborhood character. City-level scores represent the whole municipality; individual neighborhoods can differ.
What does this tell us?
Quality of Life blends cost of living, nearby amenities, socioeconomic signals, and neighborhood character. City-level scores represent the whole municipality; individual neighborhoods can differ.
Cost of Living
138% above national average
The Real Cost of Living in Hayward, CA for 2026
| Tier | Individual | Family (4) |
|---|---|---|
| Survival | $38k | $71k |
| Comfortable | $116k | $171k |
| Luxury | $171k+ | $265k+ |
| Elite (Top 5%) | $201k+ | $311k+ |
66%
The Area Signal
A metric tracking the socioeconomic signals of the area.
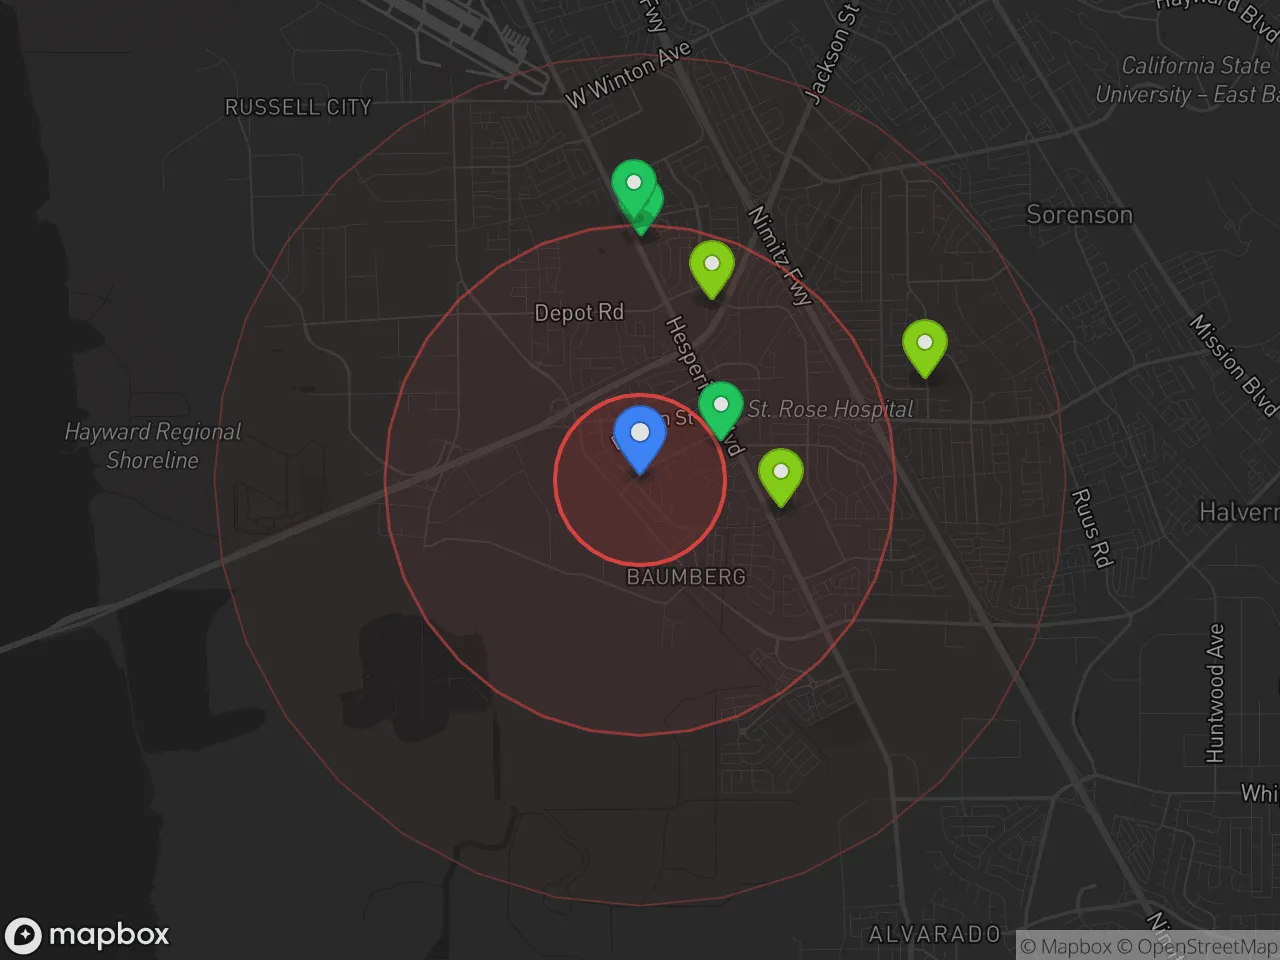
Hobbies
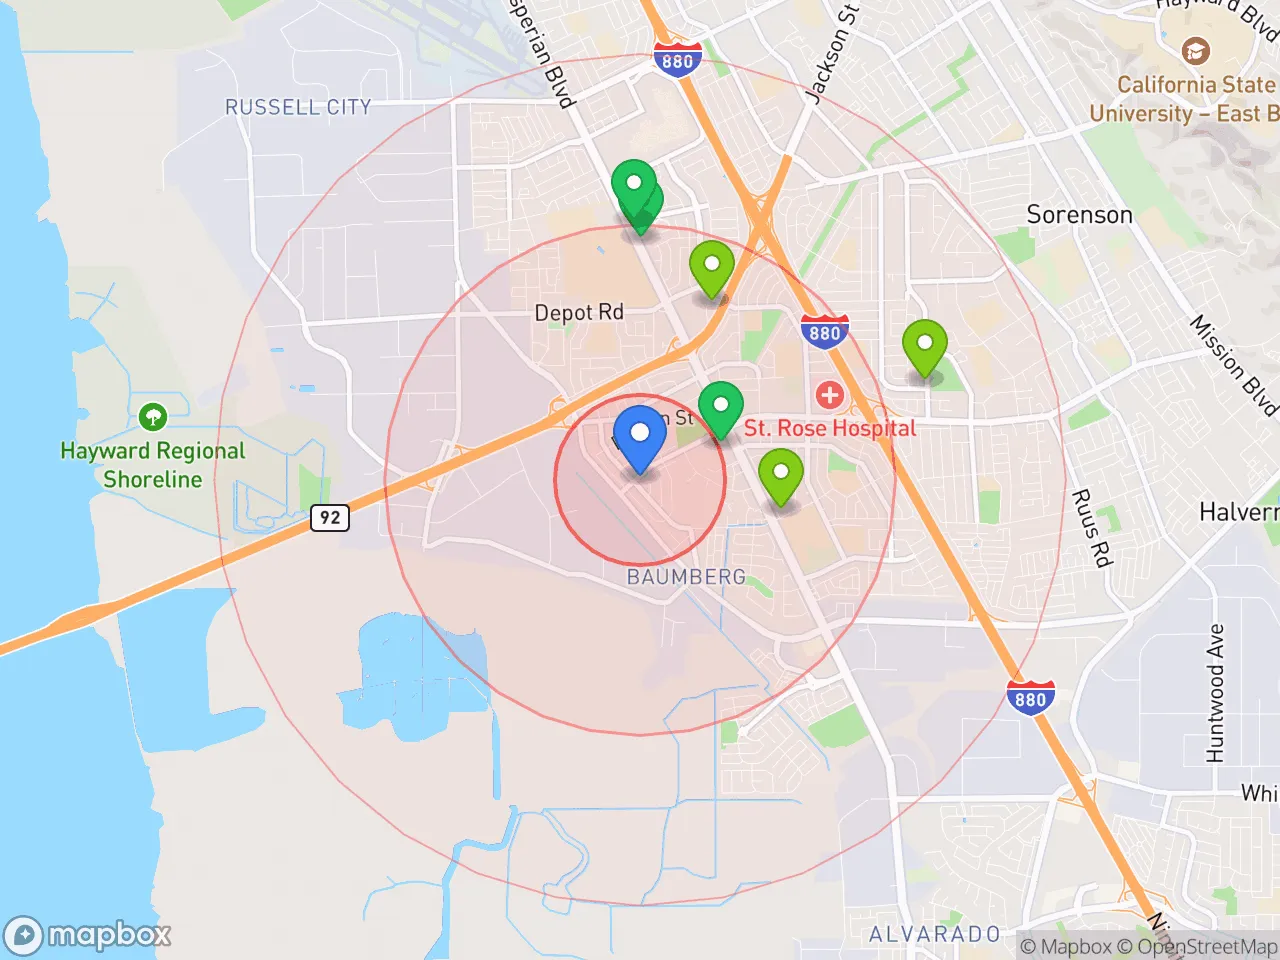
Explore the areaGroceries
6 within 10 miles
Gas
20 within 10 miles
Hospital
20 within 20 miles
Airport
SAN — Oakland San Francisco Bay
Post Office
USPS — Hayward, CA
Critical Amenities
Quality-of-Life Analysis
Hayward, California, presents a quality-of-life profile shaped by its position as a more attainable alternative within the hyper-expensive San Francisco Bay Area. With a cost-of-living index of 238—more than double the national average—the city attracts a mix of long-term working-class families, commuters employed in tech and professional services in Oakland and San Jose, and a growing population of first-time homebuyers priced out of more central markets. The city’s demographic character is notably diverse, with a large Asian American and Hispanic community, and its median household income of roughly $90,000 reflects a middle-to-upper-middle-income base that relies on dual incomes and longer commutes to sustain Bay Area residency.
Housing costs and affordability compared to Oakland and San Jose
Hayward’s housing market offers a meaningful price break relative to its neighbors, though it remains expensive by national standards. The median home value of $820,700 is roughly 30% lower than San Jose’s median of $1.2 million and about 15% below Oakland’s $970,000, making it one of the more accessible East Bay cities for buyers. Median rent sits at $2,360, which is notably cheaper than the $2,800–$3,200 range typical in San Francisco or Palo Alto, though still high for a city where the average household earns under six figures. The trade-off is space: many single-family homes in Hayward are older, smaller, and often located on busy arterial roads, while newer apartment complexes near the BART station command premium rents. For renters, the affordability gap with Fremont (median rent ~$2,800) and San Leandro (~$2,500) is narrow, but for buyers, Hayward’s lower entry point remains a key draw. The average commute of 33.7 minutes—longer than the national average of 26 minutes—reflects the reality that many residents travel to higher-paying jobs in San Francisco, Oakland, or Silicon Valley, with BART providing a direct 40-minute ride to downtown San Francisco.
Parks, schools, and the daily rhythm of life in Hayward
Daily life in Hayward centers on a network of regional parks, a walkable downtown core, and a school system that serves a high-needs population. The city operates over 40 parks, including the 1,200-acre Garin Regional Park and the Hayward Shoreline Interpretive Center, which offer hiking, birdwatching, and bay views that contrast with the urban density. The Hayward Unified School District serves roughly 20,000 students, with several schools—such as Hayward High and Tennyson High—offering International Baccalaureate programs, though overall test scores trail state averages and many families opt for private or charter options. The downtown area along B Street has seen reinvestment, with new restaurants, a weekly farmers’ market, and the historic Hayward Plunge pool, but it lacks the nightlife density of Oakland or Berkeley. For errands and shopping, the Southland Mall and the Hayward Hills provide suburban convenience, while the city’s location along Interstates 880 and 580 makes it a practical base for accessing the broader Bay Area. The daily rhythm is heavily commuter-driven: early morning BART crowds, midday quiet in residential neighborhoods, and evening traffic on Mission Boulevard.
Hayward is best suited for households that prioritize affordability and space over prestige and walkability. Families who value a yard, access to parks, and a shorter commute to East Bay jobs (e.g., at Tesla in Fremont or Kaiser in Oakland) will find the trade-offs worthwhile. Singles and couples working in San Francisco or Silicon Valley can manage the commute but should budget for BART fares and parking. Those seeking a vibrant nightlife, top-tier public schools, or a dense urban environment will likely prefer Oakland, Berkeley, or San Jose. For buyers and renters who accept a longer commute and a less polished downtown in exchange for a foothold in the Bay Area housing market, Hayward delivers a pragmatic, livable compromise.
Crime in Hayward, CA
Higher crime rates than 66% of comparable U.S. locations.
Violent CrimeViolent Crime Analysis
Property CrimeProperty Crime Analysis
Crime Analysis
Hayward, California, reports a violent crime rate of 436.5 incidents per 100,000 residents and a property crime rate of 2,624.5 per 100,000, placing it above both the national and state averages for public safety risk. These figures reflect a city where residents face elevated odds of becoming victims of theft, burglary, and assault compared to the typical U.S. municipality. The overall safety picture is further complicated by the city’s location within Alameda County, where progressive prosecutorial policies have drawn criticism for prioritizing offender rehabilitation over public protection.
Crime in context
Hayward’s violent crime rate of 436.5 per 100,000 is roughly 25% higher than the national average of approximately 370 per 100,000 and significantly above California’s state rate of about 440 per 100,000. Property crime in Hayward, at 2,624.5 per 100,000, exceeds the national average of roughly 1,950 per 100,000 by about 35%. These numbers place Hayward in a higher-risk tier among Bay Area suburbs, comparable to Oakland’s satellite cities rather than safer communities like Fremont or Pleasanton. The city’s proximity to major transit corridors (I-880, I-238) and its dense, diverse population contribute to these elevated rates, but local justice policies also play a role.
What residents experience
For daily life in Hayward, property crime is the most tangible threat. Residents commonly report vehicle break-ins, package thefts, and residential burglaries, particularly in neighborhoods near BART stations and commercial corridors like Mission Boulevard. Violent crime, while less frequent, includes aggravated assaults and robberies that often cluster in specific areas such as the downtown core and the Tennyson district. Hayward’s police department reported a 12% increase in property crime in 2023, a trend many attribute to California’s Proposition 47, which reclassified many thefts as misdemeanors, and to Alameda County District Attorney Pamela Price’s policies of reduced sentencing and pretrial diversion for repeat offenders. These progressive approaches, while intended to reduce incarceration, have been linked to a perception among criminals that consequences are minimal, emboldening property crime rings and car theft operations that cross city lines.
Neighborhood-level variation
Safety in Hayward is not uniform. The Southgate and Winton Grove neighborhoods generally report lower crime rates, with more single-family homes and active neighborhood watch programs. In contrast, areas near the Hayward BART station, the downtown corridor, and the Tennyson-Alquire district experience higher concentrations of both property and violent crime. The city’s eastern hills, including the Fairway Park area, offer a relative refuge with fewer incidents per capita. Prospective residents should research specific block-level data via the Hayward Police Department’s crime map, as a move just a few streets can meaningfully change one’s daily risk profile. The overarching reality, however, is that Hayward’s crime challenges are systemic, tied to regional policies that many critics argue prioritize offender leniency over community safety.
* Values derived from national, state, county, city and local statistics and may differ in a specific area. Last updated: 2026-04-24T12:20:46.000Z
Narrative content on this page is AI-generated and may contain mistakes. Verify any details that matter before acting on them.
ReloMaps may earn a commission from affiliate links at no extra cost to you.