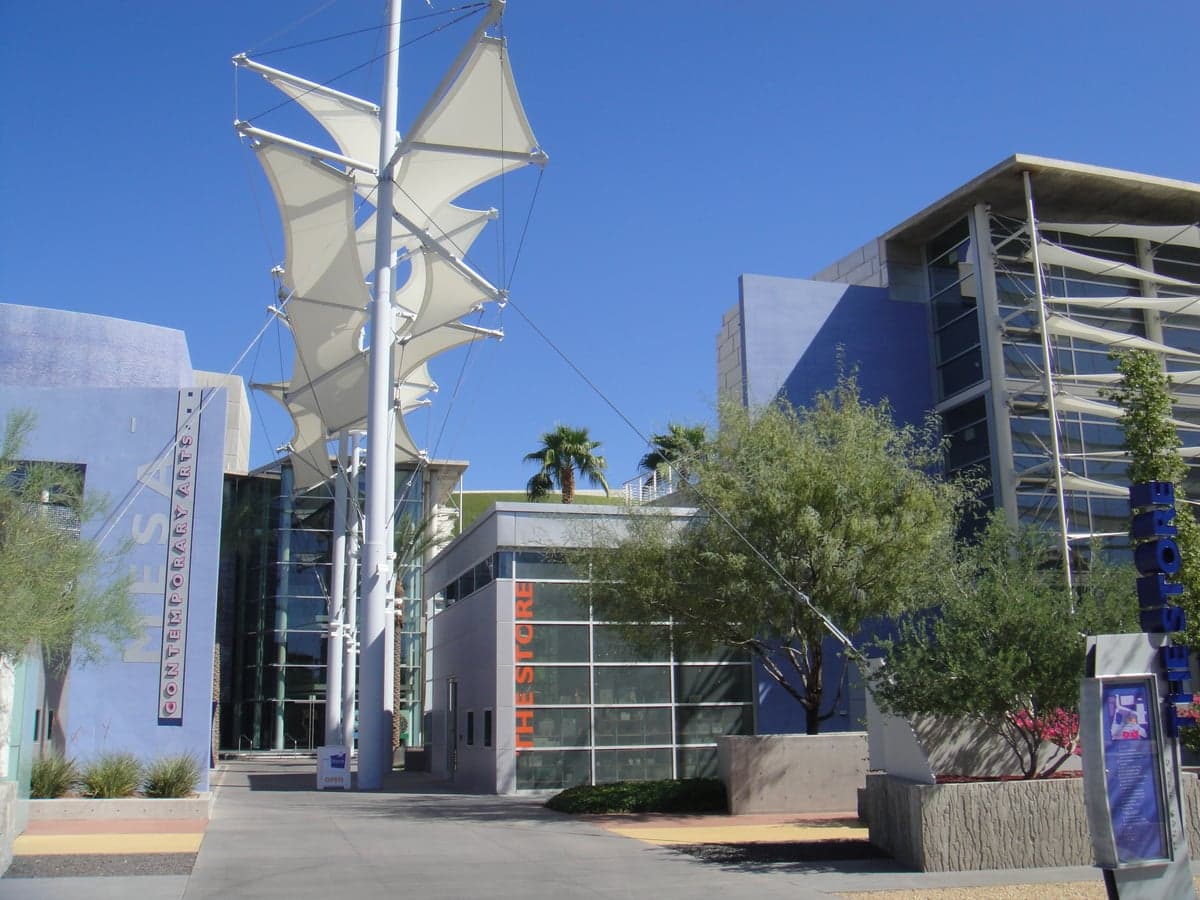
Photo: Wikipedia
Quality of Life in Mesa, AZ
Above-average quality of iife. The area offers a reasonable cost of living, decent mobility, and a mix of neighborhood amenities.
What does Quality of Life tell us?
Quality of Life blends cost of living, nearby amenities, socioeconomic signals, and neighborhood character. City-level scores represent the whole municipality; individual neighborhoods can differ.
What does this tell us?
Quality of Life blends cost of living, nearby amenities, socioeconomic signals, and neighborhood character. City-level scores represent the whole municipality; individual neighborhoods can differ.
Cost of Living
28% above national average
The Real Cost of Living in Mesa, AZ for 2026
| Tier | Individual | Family (4) |
|---|---|---|
| Survival | $24k | $44k |
| Comfortable | $71k | $104k |
| Luxury | $130k+ | $201k+ |
| Elite (Top 5%) | $153k+ | $237k+ |
76%
The Area Signal
A metric tracking the socioeconomic signals of the area.


Hobbies
Explore the areaGroceries
3 within 10 miles
Gas
0 within 10 miles
Hospital
3 within 20 miles
Airport
PHX — Phoenix Sky Harbor International
Post Office
USPS — Scottsdale, AZ
Critical Amenities
Quality-of-Life Analysis
Mesa, Arizona, presents a quality-of-life profile that blends suburban comfort with urban accessibility, attracting a diverse population of families, retirees, and young professionals. With a cost of living index of 128 (28% above the national average), Mesa is notably more affordable than neighboring Scottsdale or Paradise Valley, yet pricier than outlying communities like Apache Junction. The city’s median household income hovers around $62,000, reflecting a solidly middle-to-upper-middle-class demographic, though significant pockets of both affluence and lower-income households exist, particularly in the older central and western neighborhoods.
Cost of living, housing affordability, and how Mesa compares to nearby cities
Mesa’s housing market is a key factor in its quality-of-life equation. The median home value sits at $364,300, roughly 15% below the Phoenix metro average, while median rent is $1,478—about $200 less than in Chandler or Tempe. This pricing makes Mesa a practical choice for buyers and renters priced out of Scottsdale (median home value ~$700,000) or Gilbert (~$500,000). However, the city’s cost of living index of 128 means everyday expenses—groceries, utilities, transportation—run higher than the national norm. The average commute of 25 minutes is manageable by metro Phoenix standards, though residents commuting to downtown Phoenix or Scottsdale should budget 35–45 minutes during peak hours. Property taxes in Maricopa County average about 0.6% of assessed value, keeping annual tax bills relatively low compared to states like Texas or Illinois.
Amenities, schools, and the daily rhythm of life in Mesa
Daily life in Mesa is shaped by its sprawling geography and abundant recreational options. The city operates over 60 parks, including the 1,200-acre Usery Mountain Regional Park, and the Mesa Arts Center anchors a vibrant cultural scene with theater, galleries, and concerts. Mesa Public Schools serve roughly 60,000 students, with several campuses—like Red Mountain High School and Dobson High School—earning consistent A ratings from the Arizona Department of Education. For higher education, Arizona State University’s Polytechnic campus in southeast Mesa enrolls about 12,000 students, while Mesa Community College offers affordable two-year programs. The daily rhythm leans car-dependent; while Valley Metro light rail connects Mesa to Phoenix and Tempe, most errands require driving. The city’s 300+ days of sunshine per year encourage outdoor activity, but summer temperatures routinely exceed 105°F, limiting midday outdoor time from June through September. Grocery access is good, with major chains like Fry’s, Safeway, and Sprouts Farmers Market distributed across the city, though food deserts exist in some older neighborhoods near downtown.
Mesa works best for residents who value space, sunshine, and relative affordability over walkability or urban density. Families benefit from the strong public school options and lower home prices compared to Chandler or Gilbert. Retirees are drawn to the 55+ communities like Sunland Springs Village and the proximity to golf courses and hiking trails. Young professionals should weigh the 25-minute average commute against the trade-off of living closer to Phoenix’s job centers. The city’s conservative-leaning politics (Maricopa County voted +2 R in 2024) and growing population (projected to exceed 550,000 by 2030) mean infrastructure is under constant expansion, with new housing developments and retail centers rising along the US 60 and Loop 202 corridors. For those seeking a quieter, more affordable alternative to Scottsdale or Tempe without sacrificing access to the metro area’s amenities, Mesa delivers a balanced, if car-centric, quality of life.
Crime in Mesa, AZ
Crime rates similar to the national median for U.S. locations.
Violent CrimeViolent Crime Analysis
Property CrimeProperty Crime Analysis
Crime Analysis
Mesa, Arizona, reports a violent crime rate of 419.6 per 100,000 residents and a property crime rate of 1,296.6 per 100,000, placing it above national averages for both categories. As the third-largest city in the state, Mesa’s safety profile is shaped by its size, urban density, and the broader criminal justice policies of Maricopa County. Prospective residents should weigh these statistics against the practical realities of daily life in the city’s varied neighborhoods.
Crime in context
Mesa’s violent crime rate is roughly 20% higher than the national average of 366.7 per 100,000, while its property crime rate exceeds the national figure of 1,954.4 per 100,000 by a smaller margin. Compared to Phoenix, Mesa’s violent crime rate is lower (Phoenix reports approximately 520 per 100,000), but property crime in Mesa is slightly higher than the Phoenix metro average. Maricopa County’s criminal justice system, influenced by progressive prosecutorial policies in recent years, has faced criticism for prioritizing diversion programs and reduced sentencing over incarceration. This approach, while intended to reduce recidivism, has been linked to higher rates of repeat offenses and a perception of leniency that can embolden property criminals. Residents should be aware that these policies may contribute to Mesa’s elevated property crime numbers, as offenders face fewer consequences for theft and burglary.
What residents experience
In practice, Mesa residents report that property crime—particularly vehicle break-ins, package theft, and burglary—is the most common safety concern. Neighborhoods near major thoroughfares like Main Street and the US 60 corridor see higher rates of these incidents. Violent crime, while less frequent, is concentrated in specific areas, including parts of central Mesa and the area around Fiesta Mall. The city’s police department has implemented community policing initiatives and crime prevention programs, but the effectiveness of these efforts is tempered by the broader county-level justice policies. Progressive district attorneys in Maricopa County have been known to decline prosecution for certain low-level property crimes, a factor that directly impacts Mesa’s ability to deter repeat offenders. For families and individuals, this means that proactive measures—such as home security systems, neighborhood watch participation, and avoiding high-crime zones after dark—are essential for daily safety.
Neighborhood-level variation is significant. East Mesa, particularly areas near the Superstition Springs Mall and the Goldfield foothills, generally reports lower crime rates than central or west Mesa. The Las Sendas and Red Mountain Ranch communities are considered safer, with violent crime rates well below the city average. Conversely, the area around Dobson Road and Southern Avenue has a higher incidence of both property and violent crime. Prospective residents should research specific zip codes and consult local police crime maps to identify safer pockets within the city. Overall, Mesa offers a mix of safe and higher-risk neighborhoods, with the city’s overall safety heavily influenced by county-level justice policies that may not align with the preferences of those seeking a more conservative, law-and-order environment.
* Values derived from national, state, county, city and local statistics and may differ in a specific area. Last updated: 2026-04-19T06:52:16.000Z
Narrative content on this page is AI-generated and may contain mistakes. Verify any details that matter before acting on them.
ReloMaps may earn a commission from affiliate links at no extra cost to you.