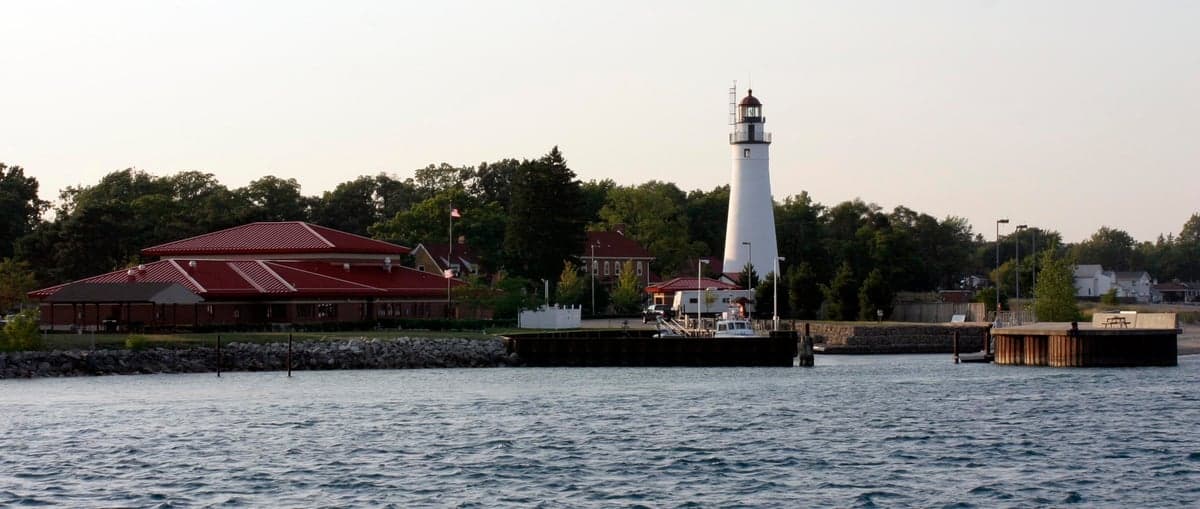
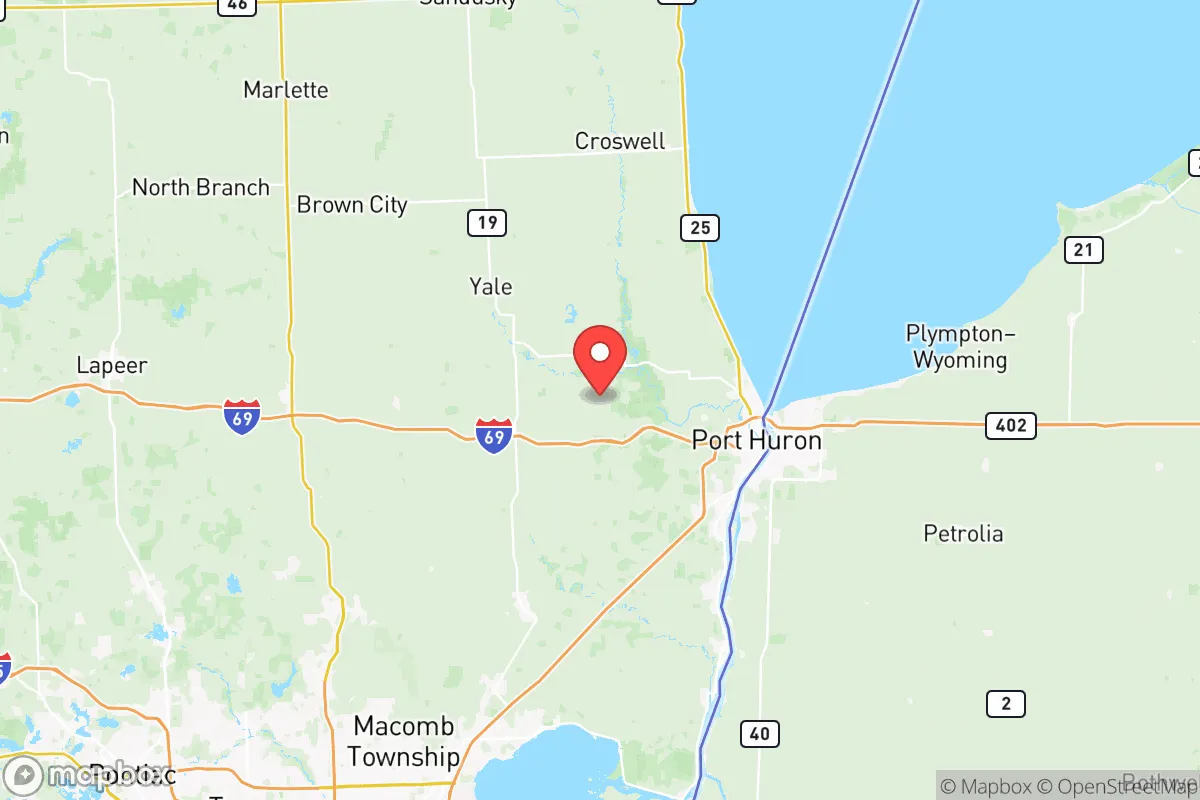
Photo: Wikipedia
Demographics of St Clair County
Affluence Level in St Clair County
A middle-class area roughly in line with national averages across income, home values, education, and employment.
People of St Clair County
St. Clair County, Michigan, is home to roughly 160,000 residents, a population that is 90.0% White and overwhelmingly U.S.-born, with a foreign-born share of just 0.8% — one of the lowest in the state. This is a working-class, family-oriented region anchored by the St. Clair River and the Blue Water Bridge, where the dominant cultural identity is shaped by generations of French, German, Polish, and Belgian settlement. The county's character is distinctly Great Lakes industrial: a place of small cities, lakefront villages, and a deep-rooted sense of local place that has changed less in the last half-century than nearly any other county in Metro Detroit's orbit.
Settlement & growth (pre-1960)
Long before European arrival, the St. Clair River corridor was home to the Ojibwe (Chippewa) and Ottawa peoples, who used the river as a primary travel and trade route between Lake Huron and Lake Erie. French explorers and missionaries were the first Europeans to pass through in the 17th century, and the region remained a sparsely settled French fur-trading outpost until after the American Revolution. The French left a lasting mark on place names — including the county seat of Port Huron, whose name derives from the French huron for the Wyandot people — and on the Catholic faith that still anchors many riverfront communities.
American settlement began in earnest in the 1820s and 1830s, driven by the promise of cheap farmland and the strategic value of the river for shipping. Yankees from New York and New England arrived first, followed in the 1840s and 1850s by a substantial wave of German immigrants who fanned out across the county's interior, establishing farming communities around Yale and Emmett. The Irish came in the same decades, many finding work on the construction of the Grand Trunk Railway, which linked Port Huron to Chicago and made the city a major rail terminus by the 1860s.
The late 19th century brought the county's defining industrial wave. The discovery of salt deposits beneath the region and the expansion of Great Lakes shipping turned Port Huron and Marysville into manufacturing hubs, attracting Polish and Belgian immigrants in the 1880s and 1890s. The Belgians, many of whom came from the Flanders region, settled heavily in the northern part of the county around Marine City and Algonac, where they worked in shipbuilding and later in the area's famous Chris-Craft boat factories. Poles concentrated in Port Huron's south side, building the parish of St. Stephen's that remains a cultural anchor today.
The early 20th century saw a second wave of Polish and German immigration, alongside a smaller but significant influx of Italian and Lebanese families drawn to the river's shipyards and the growing automotive supply chain. The 1920s and 1930s brought Black families from the American South as part of the Great Migration, settling primarily in Port Huron, where they found work in the foundries and rail yards. The county's population peaked in the 1970s at roughly 145,000, before the first wave of deindustrialization began to slow growth.
Modern era (post-1965)
The 1965 Hart-Cellar Act, which abolished national-origin quotas, had remarkably little effect on St. Clair County. Unlike the booming suburbs of Oakland County or the diverse enclaves of Detroit, this region attracted almost none of the post-1965 immigration wave. Today, the county's foreign-born population stands at just 0.8%, and the East/Southeast Asian share is a mere 0.3%, with Indian-subcontinent residents at 0.1% — figures that have barely moved in decades. The Hispanic share, at 3.6%, is the county's fastest-growing minority group, driven largely by Mexican-American families moving north from Texas and the Southwest for manufacturing and agricultural work, with small but visible concentrations in Port Huron and around the vegetable farms of the county's southern tier.
The defining demographic story of the modern era is not immigration but domestic out-migration and aging. From the 1980s through the 2010s, St. Clair County lost working-age residents to Sun Belt states and to the outer-ring suburbs of Macomb and Oakland counties, as the auto industry restructured and the riverfront factories shed jobs. The county's Black population, which never exceeded 3%, has remained stable at 2.2%, concentrated almost entirely in Port Huron. The population has been kept from outright decline by two countervailing forces: the growth of bedroom communities in the county's southwest corner, particularly around China Township and East China, which have absorbed commuters priced out of Macomb County; and the steady expansion of the county's lakeside communities — St. Clair, Lexington, and Port Sanilac — as retirement and second-home destinations for aging Baby Boomers from the Detroit metro.
Suburbanization has been modest and contained. Unlike the sprawling subdivisions of Oakland County, St. Clair County's growth has clustered along the I-94 and M-25 corridors, leaving the interior largely rural. The county's college-educated share, at 20.3%, is well below the state average, reflecting an economy still oriented toward manufacturing, healthcare, and logistics rather than professional services.
The future
St. Clair County is likely to remain one of Michigan's least diverse counties for the foreseeable future. The Hispanic population is the only group projected to grow meaningfully, potentially reaching 5-6% by 2040, as younger Mexican-American families continue to arrive for jobs in warehousing, food processing, and the expanding port logistics around the Blue Water Bridge. The East/Southeast Asian and Indian populations are expected to remain negligible, as the county lacks the professional job base that attracts skilled immigration to other parts of Metro Detroit.
The bigger demographic question is whether the county can hold its population at all. The 2020s have brought a modest reversal of the long decline, as remote work has allowed some former Detroit-area residents to move to the lakefront communities, and as the county's relatively affordable housing — median home prices roughly 30% below Macomb County — has attracted younger families. The county's age structure, however, is top-heavy, and the 2040 projections from the Southeast Michigan Council of Governments show continued slow growth of 2-4% over the next two decades, driven almost entirely by the 55-and-older cohort.
Culturally, the county is becoming more self-consciously "Blue Water" — oriented toward the river, the lake, and the outdoor recreation economy — rather than toward Detroit. The old industrial identity is fading, replaced by a tourism-and-heritage economy centered on Port Huron's riverfront, the historic districts of Marine City and St. Clair, and the wineries and orchards of the northern farm country.
For someone moving in now, St. Clair County offers a rare combination in 2026: a genuinely affordable, safe, and overwhelmingly White working-class community where the cost of living is low, the schools are solid, and the natural setting is genuinely beautiful. The trade-off is clear — this is not a diverse or cosmopolitan place, and it is not becoming one. It is a county that has chosen stability over change, and for families seeking a quiet, riverfront version of Middle America, that stability is precisely the point.

* Values derived from national, state, county, city and local statistics and may differ in a specific area. Last updated: 2026-10-16T04:02:23.000Z
Narrative content on this page is AI-generated and may contain mistakes. Verify any details that matter before acting on them.
ReloMaps may earn a commission from affiliate links at no extra cost to you.

