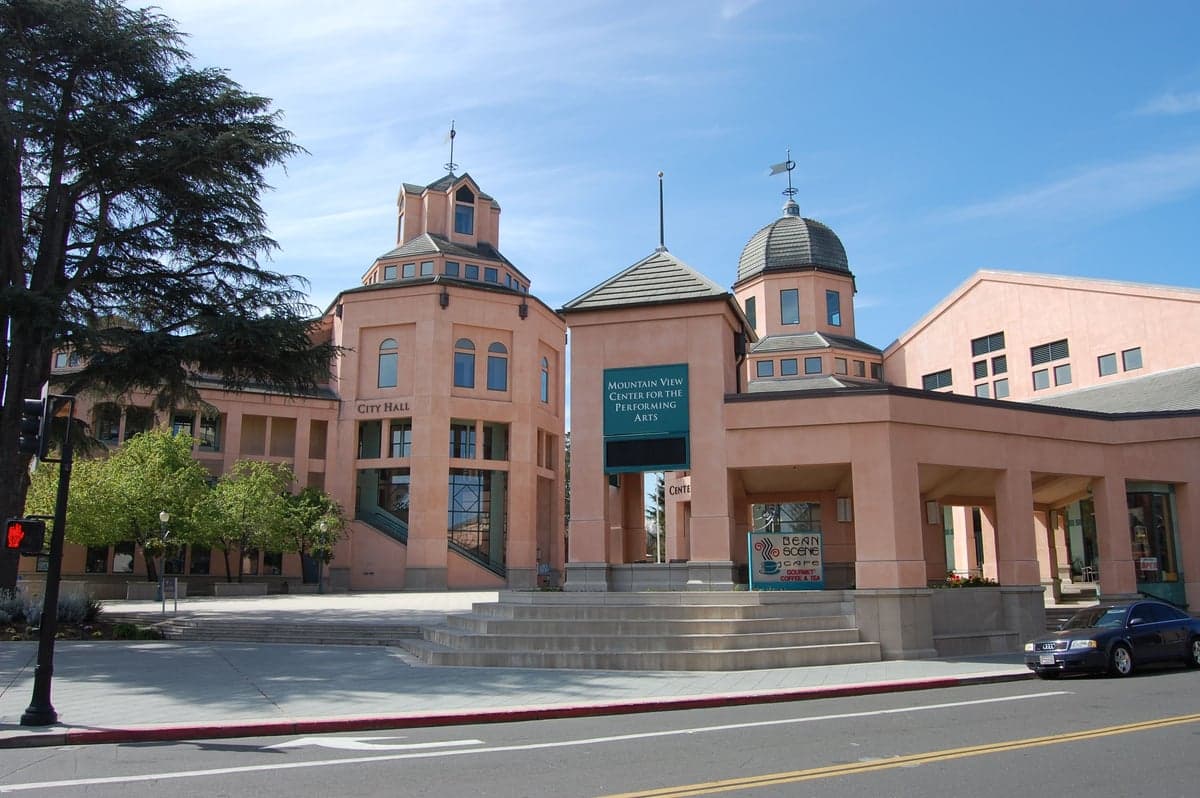
Photo: Wikipedia
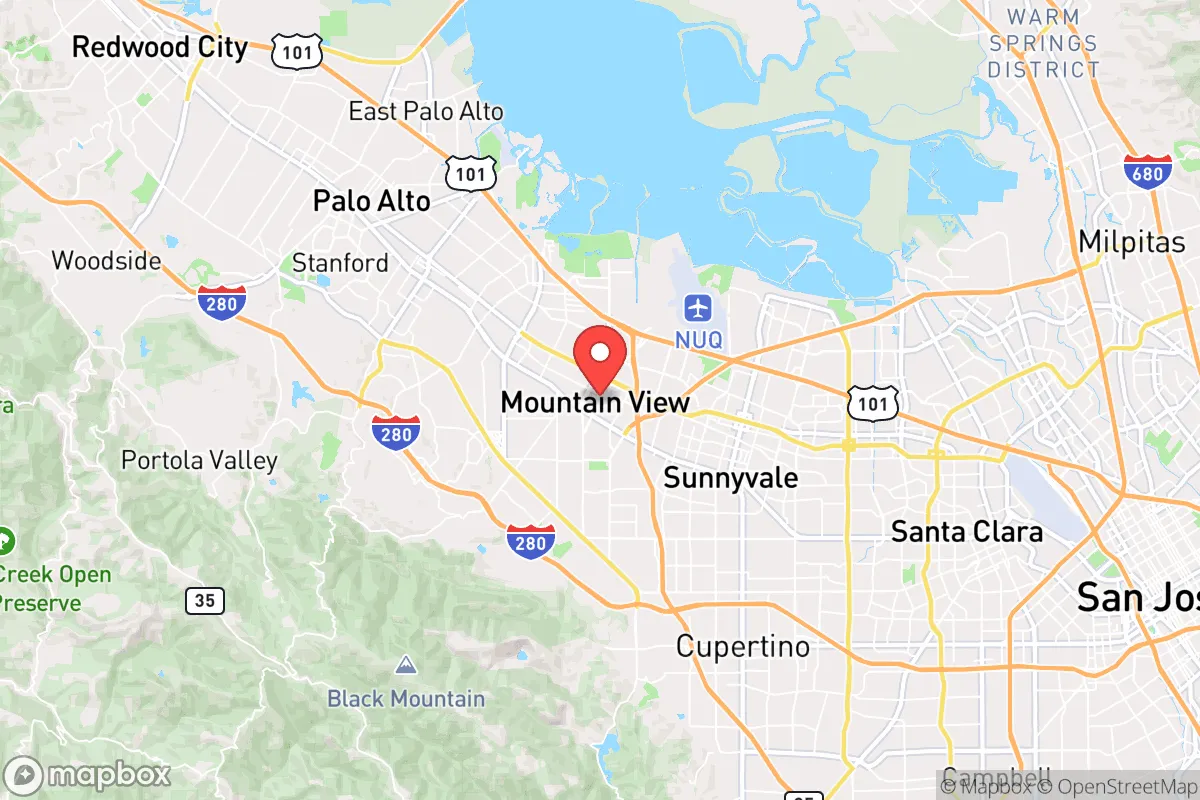
Quality of Life in Mountain View, CA
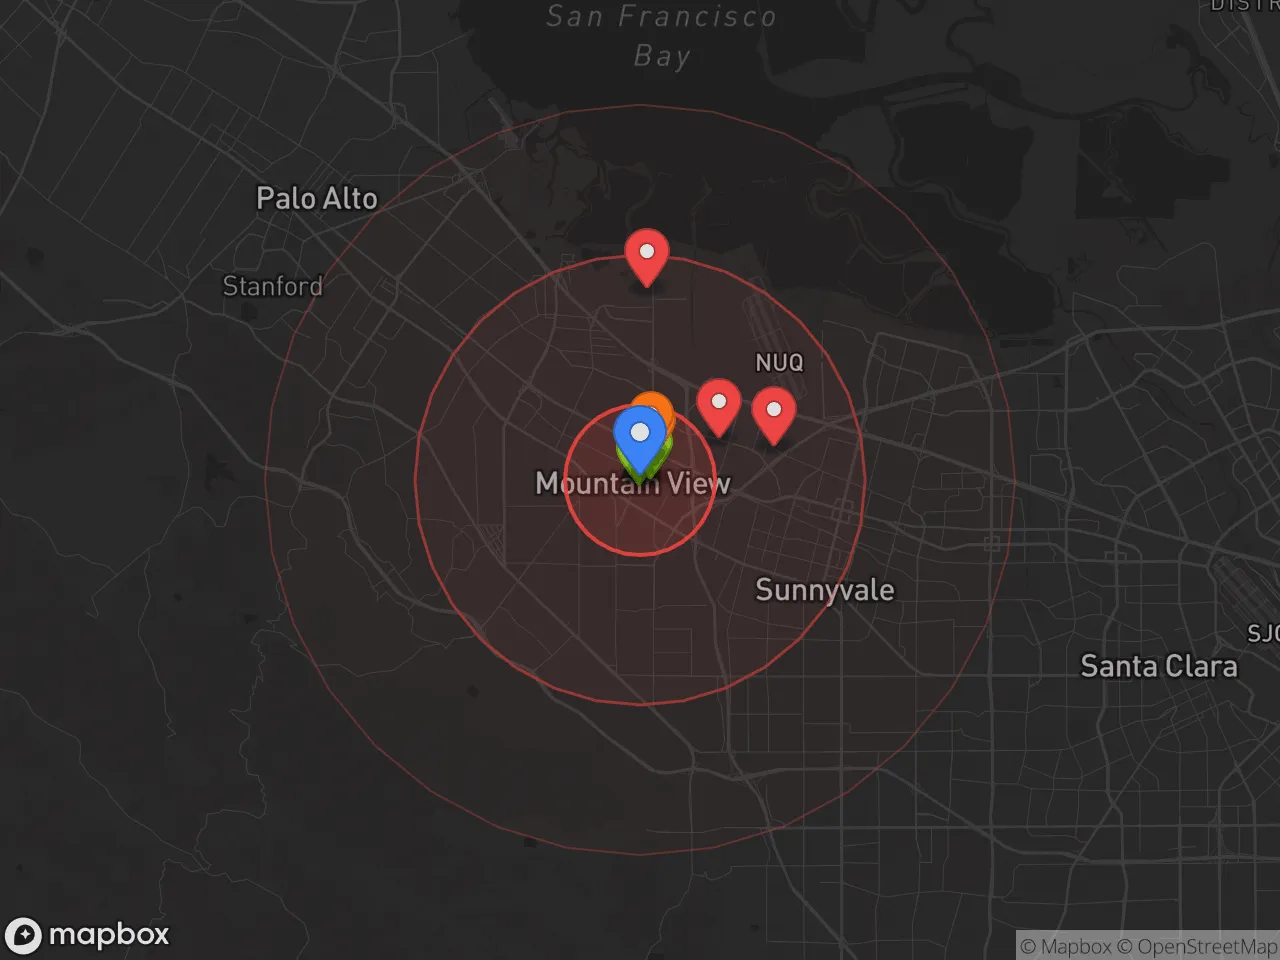
Above-average quality of iife. The area offers a reasonable cost of living, decent mobility, and a mix of neighborhood amenities.
What does Quality of Life tell us?
Quality of Life blends cost of living, nearby amenities, socioeconomic signals, and neighborhood character. City-level scores represent the whole municipality; individual neighborhoods can differ.
What does this tell us?
Quality of Life blends cost of living, nearby amenities, socioeconomic signals, and neighborhood character. City-level scores represent the whole municipality; individual neighborhoods can differ.
Cost of Living
The Real Cost of Living in Mountain View, CA for 2026
| Tier | Individual | Family (4) |
|---|---|---|
| Survival | $30k | $57k |
| Comfortable | $98k | $143k |
| Luxury | $143k+ | $222k+ |
| Elite (Top 5%) | $168k+ | $261k+ |
59%
The Area Signal
A metric tracking the socioeconomic signals of the area.
Hobbies
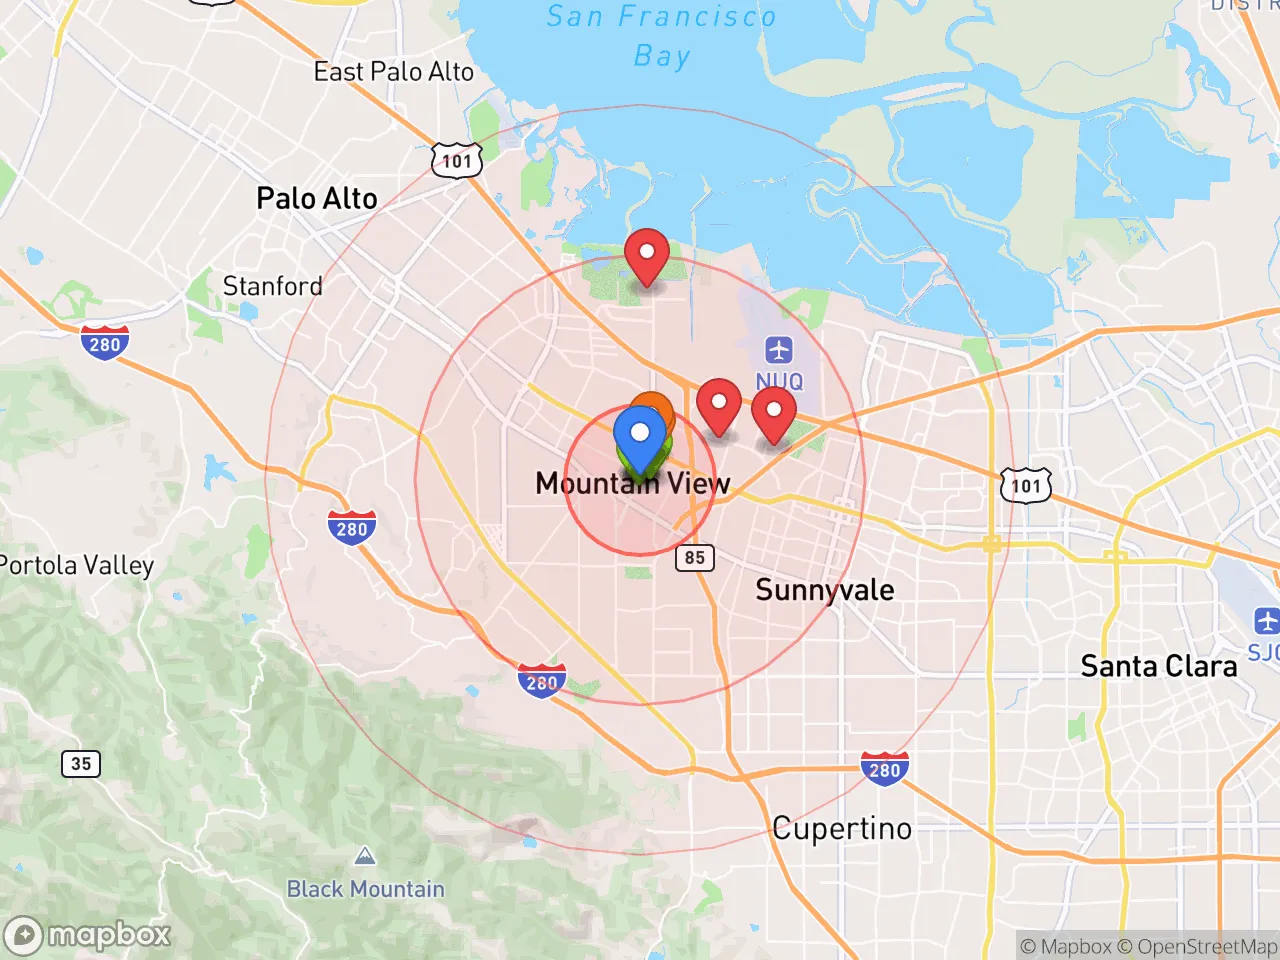
Explore the areaGroceries
7 within 10 miles
Gas
20 within 10 miles
Hospital
20 within 20 miles
Airport
SJC — San Jose International
Post Office
USPS — 211 Hope Street, Mountain
Critical Amenities
Quality-of-Life Analysis
Mountain View, California, is a high-cost, high-opportunity hub defined by its role as the epicenter of Silicon Valley, drawing a dense population of tech professionals, engineers, and entrepreneurs. With a cost of living index of 175—75% above the national average—the city’s quality of life is shaped by extreme affluence, long commutes, and a relentless focus on innovation, making it a magnet for those who prioritize career growth and urban convenience over affordability.
Cost of living, housing, and how Mountain View compares to nearby cities
Mountain View’s housing market is among the most expensive in the Bay Area, though it remains slightly more accessible than neighboring Palo Alto or Cupertino. The median home value sits at $545,100, a figure that, while high nationally, is notably lower than Palo Alto’s median of over $2 million, reflecting a mix of older condos and smaller single-family homes. Median rent is $1,888, which is below the regional average for a one-bedroom unit—often exceeding $2,500 in nearby Sunnyvale—due to a higher proportion of rent-controlled apartments and older housing stock. However, this rent figure can be misleading; many newer or market-rate units near Google’s headquarters command $3,000+ per month. The average commute time of 28.98 minutes is shorter than the Bay Area average of 32 minutes, thanks to Mountain View’s central location along Highway 101 and Caltrain lines, but traffic congestion during peak hours can push that to over 40 minutes. For context, a household earning the median Bay Area tech salary of $150,000 would spend roughly 30% of income on housing here, while a service worker earning $50,000 would face a severe cost burden, often requiring roommates or a commute from more affordable cities like San Jose.
What daily life is like: amenities, schools, and the local rhythm
Daily life in Mountain View revolves around a walkable downtown centered on Castro Street, which offers a dense cluster of restaurants, cafes, and independent shops, alongside the historic Mountain View Center for the Performing Arts. The city’s parks system is robust, with Shoreline Park and the Stevens Creek Trail providing green space and bay views, though the overall feel is more suburban than urban. The Mountain View Whisman School District is highly rated, with schools like Stevenson Elementary and Crittenden Middle School scoring 8-9 out of 10 on GreatSchools, attracting families despite the high housing costs. The local rhythm is heavily influenced by the tech industry: mornings see a flood of cyclists and shuttle buses heading to Googleplex, LinkedIn, and Microsoft campuses, while evenings bring a quieter, family-oriented pace. The city’s extensive network of bike lanes and the VTA light rail make car-free living feasible for many, but the lack of late-night entertainment options beyond downtown means nightlife is subdued compared to San Francisco or Oakland.
Mountain View is best suited for tech professionals and dual-income families who can absorb the high cost of living in exchange for short commutes, top-tier schools, and proximity to industry leaders. It is less ideal for retirees on fixed incomes, artists, or those seeking a slower, more affordable lifestyle, as the relentless economic pressure and competitive culture can feel overwhelming. For those who thrive on innovation, convenience, and a well-maintained suburban environment, Mountain View offers a quality of life that few other U.S. cities can match—but only at a steep financial premium.
Crime in Mountain View, CA
Generally safer than 62% of comparable U.S. locations.
Violent CrimeViolent Crime Analysis
Property CrimeProperty Crime Analysis
Crime Analysis
Mountain View, California, reports a violent crime rate of 205.6 per 100,000 residents and a property crime rate of 2,395.4 per 100,000. While these figures place the city below the national average for violent offenses, the property crime rate is notably elevated, reflecting a persistent challenge common across the San Francisco Bay Area. The overall safety picture is mixed: residents benefit from relatively low rates of homicide and aggravated assault, but face a tangible risk of theft, burglary, and vehicle break-ins that shapes daily caution.
Crime in context
Mountain View’s violent crime rate is roughly 40% lower than the national average, a statistic that aligns with many affluent Silicon Valley suburbs. However, its property crime rate is nearly 30% higher than the U.S. median, driven largely by auto theft and package theft. Compared to California as a whole, Mountain View is safer for violent crime but worse for property crime—a pattern that mirrors nearby cities like Sunnyvale and Palo Alto. The presence of progressive district attorneys in Santa Clara County, who have implemented policies such as reduced cash bail and diversion programs for nonviolent offenders, is a significant factor. Critics argue these approaches, while intended to reduce incarceration, have contributed to a revolving-door effect for property criminals, undermining deterrence and public confidence in the justice system.
What residents experience
For those living in Mountain View, the most common safety concern is property crime. Car break-ins and bike thefts are routine, especially near downtown, the Caltrain station, and the Googleplex campus. Residents report that police response to property crimes is often limited to taking a report, as resources are stretched and prosecution rates for low-level theft remain low under current county policies. Violent crime is rare but not absent: incidents of robbery and simple assault do occur, typically in commercial corridors late at night. The city’s overall sense of safety is high during the day, but many residents avoid leaving valuables in vehicles and use security cameras as a precaution. The progressive judicial philosophy in Santa Clara County means that repeat property offenders frequently receive lenient sentences, a reality that frustrates victims and fuels a perception that the system prioritizes offender rehabilitation over public protection.
Neighborhood-level variation is notable. Areas west of El Camino Real, such as the Old Mountain View and Cuesta Park neighborhoods, see fewer property crimes than the more transit-accessible eastern side near Shoreline Boulevard and the San Antonio Road corridor. The downtown area and the Whisman Station district, with their mix of apartments and retail, report higher rates of theft and vandalism. Gated communities and newer developments near the Stevens Creek Trail tend to have lower incident rates, while older apartment complexes near major thoroughfares are more vulnerable. Overall, Mountain View is a safe city by national standards, but its property crime problem—exacerbated by a lenient local justice system—requires constant vigilance from residents and visitors alike.
* Values derived from national, state, county, city and local statistics and may differ in a specific area. Last updated: 2026-05-02T04:57:22.000Z
Narrative content on this page is AI-generated and may contain mistakes. Verify any details that matter before acting on them.
ReloMaps may earn a commission from affiliate links at no extra cost to you.