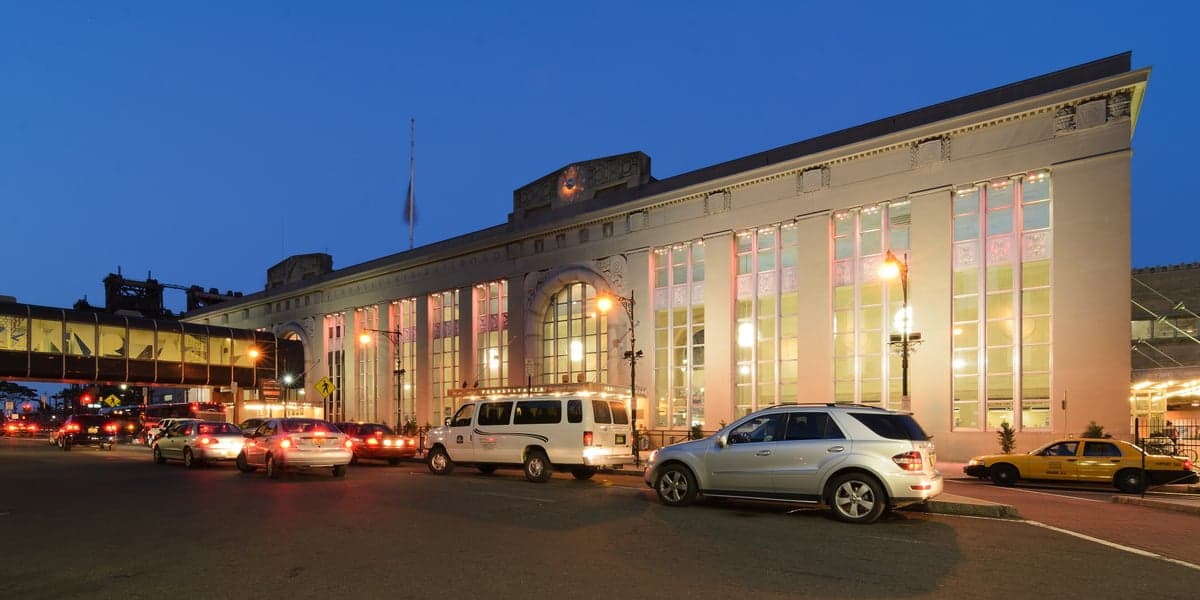
Photo: Wikipedia
Demographics of Essex County
Affluence Level in Essex County
A middle-class area roughly in line with national averages across income, home values, education, and employment.
People of Essex County
Essex County, New Jersey, is one of the most densely populated and ethnically diverse counties in the United States, home to 854,130 residents. Its character is defined by a stark contrast: the urban intensity of Newark, the county seat and largest city, alongside affluent, leafy suburbs like Montclair and Millburn. The population is a mosaic of Black (36.0%), Hispanic (24.7%), and White (27.9%) communities, with significant and growing East/Southeast Asian (3.2%) and Indian subcontinent (2.6%) populations, creating a complex social fabric where distinct ethnic enclaves and economic divides coexist within a small geographic area.
Settlement & growth (pre-1960)
The original inhabitants of the area were the Lenape people, who lived in seasonal settlements along the Passaic River and its tributaries for centuries before European contact. Dutch colonists, part of the New Netherland colony, began settling the region in the 1660s, establishing trading posts and small farms. The English took control in 1664, and Essex County was formally created in 1683, named after the English county. The early colonial population was a mix of Dutch, English, and a small number of Scots-Irish and French Huguenot families, who established the first permanent settlements in what are now Newark, Elizabeth (now in Union County), and the Oranges.
The 19th century brought transformative waves of immigration. The construction of the Morris Canal and the rise of manufacturing in Newark—particularly in leather, brewing, and jewelry—drew a massive influx of German and Irish immigrants between 1840 and 1880. These groups settled heavily in Newark's Ironbound district and the working-class neighborhoods of the city's South and East Wards. By the 1880s, southern and eastern European immigration surged. Italians, primarily from southern Italy and Sicily, formed a dense enclave in Newark's Seventh Avenue and Bloomfield Avenue corridors, while Polish and Jewish immigrants from the Russian Empire and Austria-Hungary concentrated in the city's Weequahic and Clinton Hill sections. The city of Bloomfield and the town of Irvington also absorbed large numbers of these groups, becoming industrial suburbs.
The Great Migration of African Americans from the Jim Crow South began in earnest during World War I and accelerated through the 1940s and 1950s. Black families moved into Newark, particularly the Central Ward, and into the city of East Orange, seeking industrial jobs in factories and the Port of Newark. This period also saw the arrival of Puerto Ricans, who began settling in Newark's North Ward and the city of Harrison (now in Hudson County) in the 1950s, establishing the first significant Hispanic community in the county. By 1960, Essex County was a dense, industrial powerhouse, but its population had already begun its peak and subsequent decline from a high of over 900,000 in the 1950 census.
Modern era (post-1965)
The 1965 Hart-Cellar Act fundamentally reshaped Essex County's demographics. The immediate post-1965 wave saw a dramatic increase in immigration from the Caribbean and Latin America. Dominicans, Ecuadorians, and Colombians established large communities in Newark's North and East Wards, as well as in the city of Belleville and the township of Nutley. The 1967 Newark riots accelerated white flight to the suburbs, dramatically shifting the racial composition of the county's core. Newark's population went from a majority White in 1960 to a majority Black by 1970, a transformation that reshaped the county's political and economic landscape.
The 1980s and 1990s brought a new wave of immigration from Asia and the Indian subcontinent. East/Southeast Asian communities, particularly Chinese and Korean immigrants, established a significant presence in the affluent suburbs of Livingston and Millburn/Short Hills, drawn by top-ranked public schools and proximity to New York City. Indian subcontinent immigrants, primarily from Gujarat and Punjab, concentrated in the towns of Edison (Middlesex County) and Parsippany (Morris County), but within Essex County, they formed a notable and growing community in the city of West Orange and the township of Verona. The Hispanic population continued to diversify and grow, with a significant influx of Brazilians settling in the Ironbound district of Newark, which became a major commercial hub for the community. The Black population, while still the largest single group, began to see internal diversification with the arrival of immigrants from West African nations like Ghana and Nigeria, who settled in Irvington and East Orange.
Domestic migration patterns have also shaped the modern county. The decline of manufacturing in the 1970s and 1980s led to population loss in Newark and the inner-ring suburbs, but the county has seen a resurgence in the 21st century. Young professionals and empty-nesters have been drawn back to Newark's downtown, which has seen significant redevelopment, and to walkable suburbs like Montclair and Maplewood, which offer a mix of urban amenities and suburban space. This has led to a gradual gentrification of certain neighborhoods, increasing the White population in some areas after decades of decline.
The future
Essex County's demographic future points toward continued diversification and a slow but steady increase in its foreign-born population, currently at 14.3%. The Hispanic and Asian/Indian subcontinent populations are projected to grow, while the non-Hispanic White and Black populations are likely to see their relative shares decline or stabilize. The county is not homogenizing; rather, it is tribalizing into distinct, self-reinforcing enclaves. The Ironbound remains a stronghold for Portuguese and Brazilian communities, while the Oranges and Irvington are predominantly Black, and the western suburbs like Livingston and Millburn are increasingly Asian and Indian. The Hispanic population is spreading from Newark into the first-ring suburbs like Belleville and Bloomfield, creating a more diffuse pattern.
In-migration is changing the cultural identity of the county, but it is being absorbed into a broader, hyper-diverse metropolitan identity. The next 10-20 years will likely see the continued redevelopment of Newark's downtown and the strengthening of its role as a regional employment and cultural hub. The county's school systems will face the challenge of integrating increasingly diverse student bodies, while housing affordability will remain a critical issue, potentially pushing lower-income families further out to counties like Passaic or Hudson. The political landscape, currently dominated by the Democratic Party, will continue to reflect the interests of a multi-ethnic coalition, with tensions between established Black political leadership and the growing Hispanic and Asian constituencies.
Essex County is becoming a place where the American melting pot is being tested in real time, with distinct communities living in close proximity but often separate social worlds. For someone moving in now, the county offers a choice: the high-density, diverse, and rapidly changing urban environment of Newark, or the stable, affluent, and increasingly diverse suburbs of the western towns. The common thread is proximity to New York City and a population that is accustomed to change, making it a dynamic but demanding place to call home.
* Values derived from national, state, county, city and local statistics and may differ in a specific area. Last updated: 2026-05-12T00:42:13.000Z
Narrative content on this page is AI-generated and may contain mistakes. Verify any details that matter before acting on them.
ReloMaps may earn a commission from affiliate links at no extra cost to you.