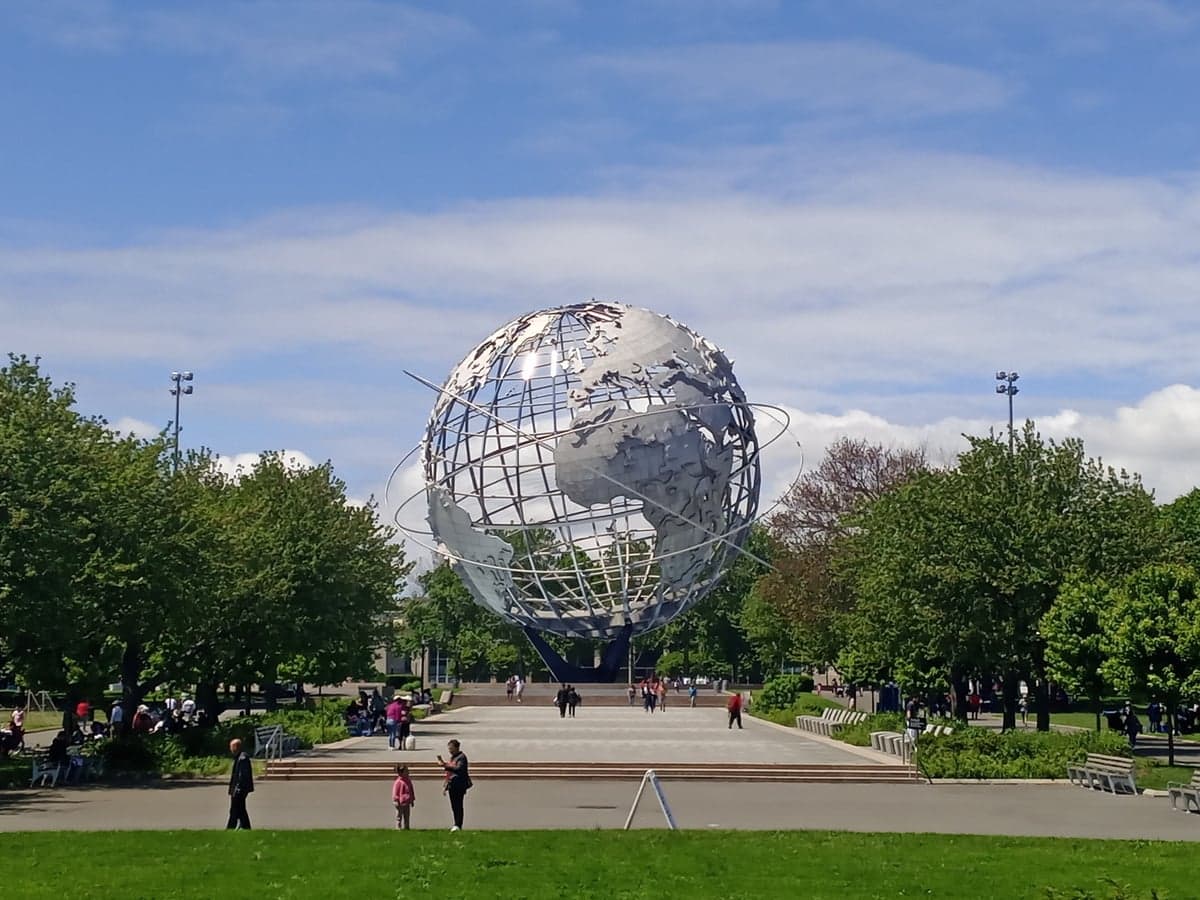
Photo: Wikipedia
Quality of Life in Queens County
A livable area that tracks near national norms for affordability, walkability, and neighborhood health.
What does Quality of Life tell us?
Quality of Life measures an area by evaluating factors like cost of living, nearby amenities, country club access, airport proximity, socioeconomic signals and neighborhood character. For large states, this is a general average — quality of life can vary dramatically between metro areas, suburbs, and rural communities within the same state.
What does this tell us?
Quality of Life measures an area by evaluating factors like cost of living, nearby amenities, country club access, airport proximity, socioeconomic signals and neighborhood character. For large states, this is a general average — quality of life can vary dramatically between metro areas, suburbs, and rural communities within the same state.
Cost of Living
98% above national average
55%
The Real Cost of Living in Queens County for 2026
| Tier | Individual | Family (4) |
|---|---|---|
| Survival | $31k | $57k |
| Comfortable | $105k | $155k |
| Luxury | $153k+ | $238k+ |
| Elite (Top 5%) | $181k+ | $281k+ |
Quality-of-Life Analysis
Queens County, New York, presents one of the most dramatic quality-of-life spectrums in the United States, ranging from the hyper-urban, transit-saturated neighborhoods of Long Island City and Astoria to the quiet, suburban-style streets of Bellerose and the semi-rural enclaves of the North Shore's Douglaston and Little Neck. This is not a county of a single character; it is a patchwork of distinct villages, each with its own housing stock, demographic profile, and daily rhythm. The county's overall cost-of-living index sits at 198 (100 equals the U.S. average), with a median home value of $699,200 and a median rent of $1,915, but those averages mask a spread that ranges from high-rise luxury rentals to detached single-family homes on tree-lined blocks.
Largest town(s) & population centers
The county's most populous and dynamic centers are concentrated along the western waterfront and the central spine. Long Island City is the county's fastest-growing hub, a former industrial district transformed into a skyline of glass towers, with the median rent here often exceeding the county average by 30-40% for new construction. Daily life is defined by the 7 train, the N/W lines, and the East River Ferry, with a dense concentration of tech offices, art galleries, and the MoMA PS1 museum. Astoria, directly north, offers a more established, mid-rise urban feel, famous for its Greek and Middle Eastern dining corridors along Ditmars Boulevard and 30th Avenue, attracting young professionals and creative-class renters. Further east, Flushing serves as the county's second downtown, a bustling, walkable commercial core centered around Main Street and the Flushing Commons development, with a median home value near the county figure but a rental market that skews slightly lower due to older housing stock. Jamaica functions as a major transit and civic hub, anchored by the Jamaica Center and York College, offering some of the county's most affordable rental options near the LIRR and AirTrain JFK.
Smaller towns & rural pockets
Moving east and south, the character shifts dramatically. Bellerose and Floral Park, along the Nassau County border, are classic post-war suburban villages with detached Cape Cod and Tudor homes, quiet cul-de-sacs, and a median home value that often runs 10-15% above the county average. The North Shore communities of Douglaston and Little Neck are the county's most rural-feeling pockets, featuring the Douglaston Hill Historic District, the 200-acre Alley Pond Park, and waterfront properties along Little Neck Bay; these areas offer large lots and a semi-rural, almost New England-like atmosphere that is a stark contrast to western Queens. In the southeast, Breezy Point and Rockaway Park on the Rockaway Peninsula provide a beach-town lifestyle, with bungalow-style homes and a median home value that dips below the county average, though flood insurance costs are a significant factor. Whitestone and Malba offer quiet, waterfront suburban living with some of the county's highest-priced single-family homes, particularly along the East River shore.
Cost & lifestyle range
The cost spread is stark. At the high end, Long Island City's new luxury towers command rents of $4,000-$6,000 for one-bedrooms, while Malba and Douglaston waterfront homes list from $1.5 million to over $3 million. At the low end, Jamaica and Richmond Hill offer median rents near $1,600-$1,800, and older co-ops in Kew Gardens Hills and Briarwood can be purchased for $350,000-$450,000, well below the county median. The average commute of 43.1 minutes reflects this geographic spread: residents in western Queens can reach Midtown Manhattan in 20-30 minutes, while those in Bellerose or Douglaston often face 50-60 minute LIRR or subway journeys. Amenities follow the same gradient — western Queens has 24-hour dining and nightlife, while eastern neighborhoods rely more on local shopping strips and car-dependent errands, with parking significantly easier to find.
Queens County rewards residents who know exactly what they want. Young professionals and artists thrive in the transit-rich, amenity-dense west; families seeking good public schools and yard space find their niche in Bellerose, Bayside, and Douglaston; and those wanting a beach-adjacent, slower pace settle in the Rockaways. The county's diversity — both demographic and geographic — means that no single lifestyle dominates, and the 198 cost-of-living index is a price paid for access to the widest range of urban, suburban, and semi-rural living options within a single New York City borough.

Crime in Queens County
WARNING: The crime statistics are unreliable for this jurisdiction. Local authorities have either not reported or under reported their data to the FBI. This could be due to bad intentions, incompetence or technical issues. Regardless, we suggest skepticism.
Higher crime rates than 65% of comparable U.S. locations.
Violent CrimeViolent Crime Analysis
Property CrimeProperty Crime Analysis
Crime Analysis
Queens County presents a mixed safety picture in 2026, with violent crime at 363.5 incidents per 100,000 residents and property crime at 1,547.4 per 100,000. These figures place Queens in the middle tier of New York City boroughs, safer than the Bronx but statistically more dangerous than Staten Island or Manhattan's residential core. The county's 2.3 million residents experience crime unevenly, with western neighborhoods like Long Island City and Astoria seeing different dynamics than southeastern communities such as Howard Beach and Bellerose.
Crime in context
Queens' violent crime rate of 363.5 per 100,000 sits roughly 25% below the national average of approximately 380 per 100,000, but it remains significantly higher than New York State's overall rate of about 350 per 100,000. Property crime in Queens, at 1,547.4 per 100,000, runs notably higher than both the state average (roughly 1,100) and the national figure (approximately 1,950), though it trails the national number. The gap between Queens' violent and property crime rates reflects a pattern common across New York City's outer boroughs: theft, burglary, and motor vehicle theft drive the totals more than assault or homicide. Queens District Attorney Melinda Katz's office has faced criticism from public safety advocates for its diversion programs and bail reform positions, which some argue have contributed to repeat offending in precincts like the 103rd in Jamaica and the 109th in Flushing.
What residents experience
Daily life in Queens involves navigating a patchwork of risk. Grand Larceny and shoplifting account for nearly 60% of all property crimes, with retail corridors in Flushing's Main Street district and the Queens Center Mall area in Elmhurst reporting the highest volumes. Auto theft has spiked in the northeastern precincts covering Bayside and Douglaston, where luxury SUVs remain targets. Violent incidents concentrate in specific corridors: Jamaica, Ozone Park, and Far Rockaway consistently report the highest rates of robbery and assault, while Forest Hills, Kew Gardens, and Whitestone maintain some of the lowest violent crime numbers in the borough. Residents in the safer eastern and central neighborhoods report feeling secure walking at night, whereas those in the 103rd and 113th precincts (covering Jamaica and South Ozone Park) describe a more cautious daily routine. The NYPD's 105th Precinct in Queens Village has seen a 17% increase in felony assaults since 2023, a trend local community boards attribute to recidivism among individuals released under the state's 2019 bail reform law.
Neighborhood-level variation is stark. Long Island City and Astoria, with their dense new developments, post violent crime rates near 250 per 100,000 — closer to Manhattan's safer precincts. By contrast, Far Rockaway's 101st Precinct exceeds 500 per 100,000, driven by domestic violence and gang-related disputes. Property crime tells a different story: affluent neighborhoods like Bellerose and Little Neck report higher per-capita burglary rates than Jamaica, reflecting opportunity-based targeting of unoccupied homes. For families and professionals relocating to Queens, the practical takeaway is to evaluate safety at the precinct level rather than the borough level. The 112th Precinct in Forest Hills and the 111th in Bayside offer the most favorable crime profiles, while the 103rd in Jamaica and the 101st in Far Rockaway warrant additional caution. Queens' progressive prosecutorial policies, including Katz's emphasis on alternatives to incarceration, remain a point of concern for residents who believe softer approaches have lengthened the tail of property crime and public disorder in transit hubs like Sutphin Boulevard and Roosevelt Avenue.
* Values derived from national, state, county, city and local statistics and may differ in a specific area. Last updated: 2026-10-13T23:53:35.000Z
Narrative content on this page is AI-generated and may contain mistakes. Verify any details that matter before acting on them.
ReloMaps may earn a commission from affiliate links at no extra cost to you.

