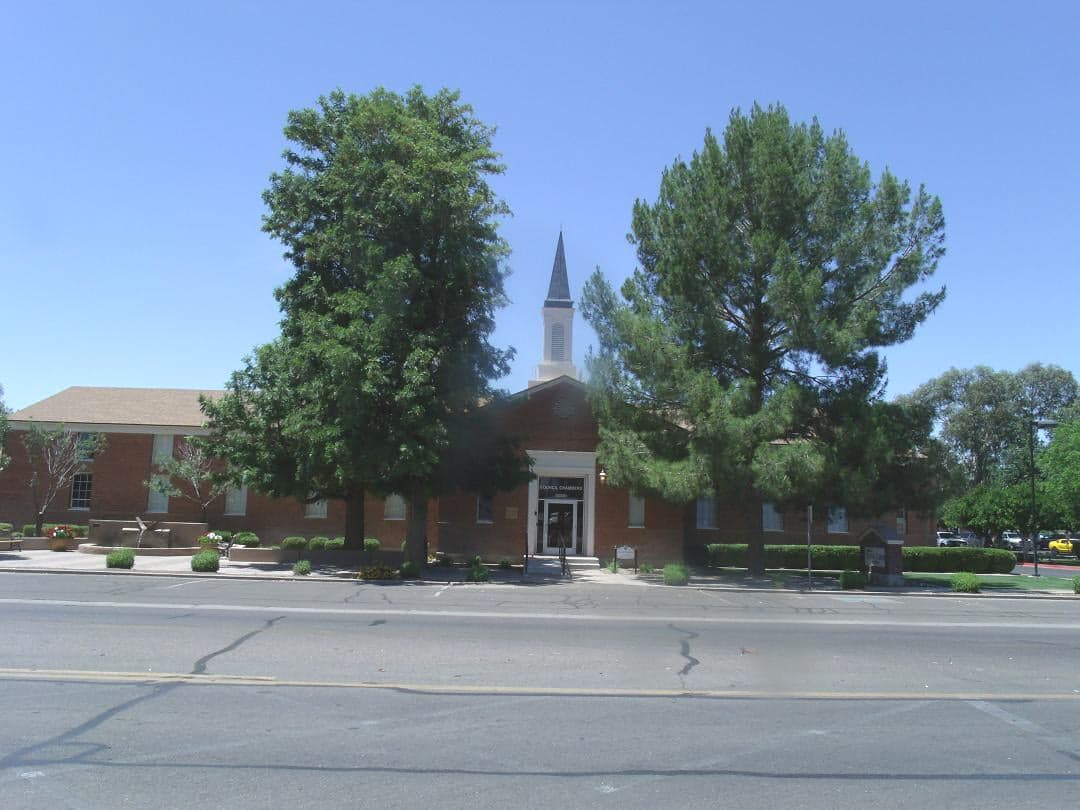
Photo: Wikipedia
Demographics of Queen Creek, AZ
Affluence Level in Queen Creek, AZ
An upper-middle-class area. Household wealth, education levels, and homeownership run ahead of national benchmarks.
People of Queen Creek, AZ
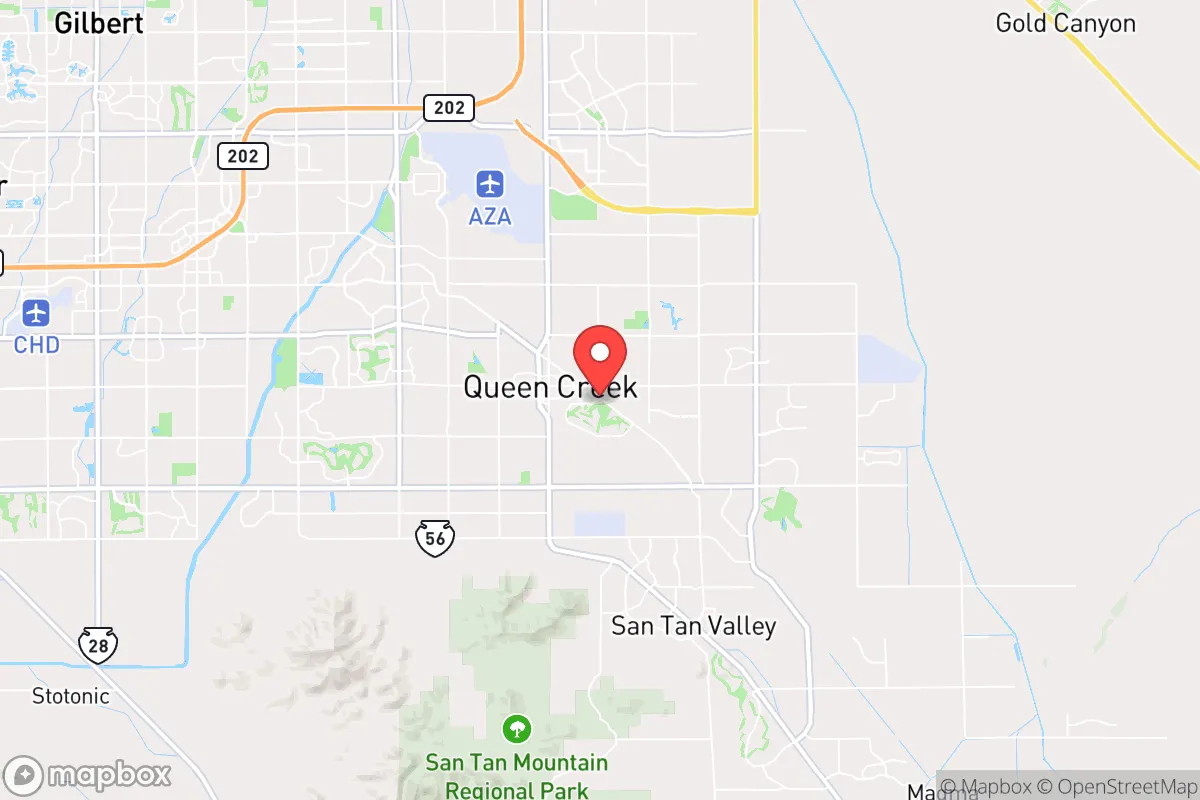
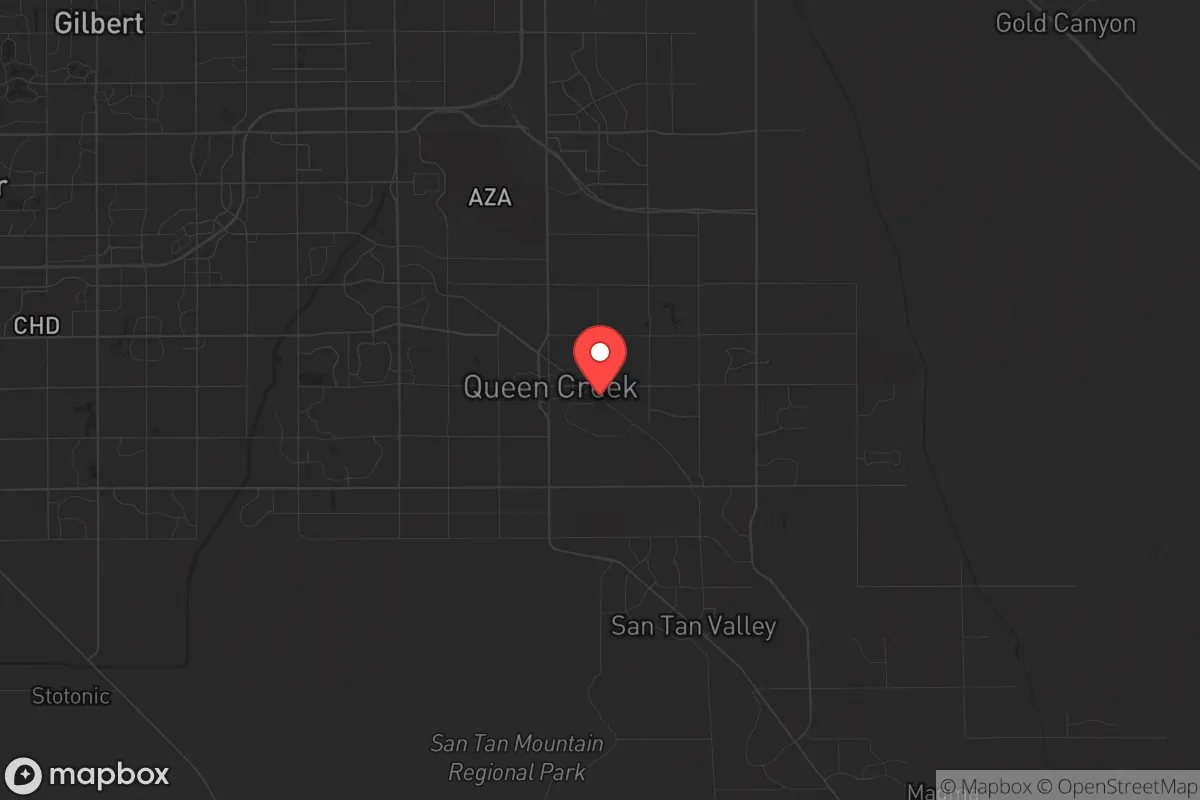
Queen Creek, Arizona, is a rapidly growing suburban community of 66,369 residents that has transformed from a sparsely populated farming crossroads into a predominantly white, family-oriented exurb. The city’s population is 72.0% White, 16.8% Hispanic, 3.0% Black, 2.2% East/Southeast Asian, and 0.6% Indian (subcontinent), with a notably low foreign-born share of just 1.9%. Nearly 45% of adults hold a college degree, reflecting a well-educated, middle-to-upper-income demographic that values space, new housing, and conservative governance. The city’s identity is defined by master-planned subdivisions, equestrian properties, and a strong sense of being a deliberate escape from the density of metro Phoenix.
How the city was settled and grew
Queen Creek’s human history begins in the late 19th century, not with a town plat but with homesteaders drawn by the promise of irrigated farmland along the Queen Creek Wash. The area’s original settlers were predominantly Anglo-American farmers from the Midwest and Texas, who arrived after the 1880s to grow cotton, alfalfa, and citrus. The first concentrated settlement formed around the Rittenhouse Elementary School area (now the historic core near Ellsworth and Rittenhouse roads), where families built modest farmhouses and relied on the Southern Pacific Railroad spur for shipping crops. By the 1920s, a small Hispanic community had also taken root, working as farm laborers and settling in what is now the Old Town Queen Creek district, a cluster of early 20th-century homes and commercial buildings along Ellsworth Road. The town remained tiny—fewer than 500 residents—through the 1950s, with no incorporated government and a population that was almost entirely White and Hispanic agricultural families.
Modern era (post-1965)
The post-1965 transformation of Queen Creek began slowly, then accelerated dramatically after 2000. The 1965 Immigration and Nationality Act had little direct effect here—Queen Creek’s foreign-born population remains just 1.9%—but the domestic migration wave that reshaped the Sun Belt did. In the 1980s and 1990s, Phoenix’s suburban sprawl pushed eastward, and developers began buying up cotton fields for master-planned communities. The first major modern subdivision was Pecan Creek (opened in the late 1990s near Signal Butte and Ocotillo roads), which attracted White middle-class families from California and the Midwest seeking affordable acreage and low crime. The 2000s brought an explosion of new construction: Queen Creek Station (near Ellsworth and Chandler Heights) drew younger families with its proximity to the new freeway, while Ironwood Crossing (south of Queen Creek Road) became a hub for upper-middle-class professionals, many of whom worked in Chandler’s tech sector. Hispanic residents, who had historically lived in Old Town, began moving into newer subdivisions like Val Vista Lakes (a gated community near Germann and Val Vista) as incomes rose, though the overall Hispanic share (16.8%) remains below the Maricopa County average. The Black population (3.0%) and East/Southeast Asian population (2.2%) are small but concentrated in the newer, higher-end developments like Encanterra (an active-adult community) and the Power Ranch area, reflecting a pattern of income-based rather than ethnic clustering. Indian (subcontinent) residents (0.6%) are a very recent arrival, mostly professionals drawn to the same subdivisions as their East Asian neighbors.
The future
Queen Creek’s population trajectory points toward continued growth and gradual homogenization, not tribalization into ethnic enclaves. The city’s buildable land is rapidly filling, with annexations pushing south toward the Gila River Indian Community boundary and east toward Florence. New developments like Mountain Vista and Horseshoe Park are targeting the same demographic: White, college-educated families with children. The Hispanic share is likely to rise slowly as second-generation families move from older Phoenix neighborhoods into Queen Creek’s newer housing stock, but the foreign-born rate will probably remain below 3% because the city lacks the rental stock and transit access that attract recent immigrants. The East/Southeast Asian and Indian populations are growing from a tiny base and will likely double over the next decade, but they will remain a small minority, assimilating into the broader suburban culture rather than forming distinct ethnic neighborhoods. The Black population is also growing slowly, driven by middle-class families seeking good schools and low crime. The city is not homogenizing in a racial sense—it is becoming slightly more diverse—but it is homogenizing in a socioeconomic sense: nearly everyone who moves here is a homeowner with a college degree and a family, and the rental rate is below 20%. The next 10-20 years will see Queen Creek become a fully built-out, upper-middle-class suburb of 100,000+ residents, with a population that is 65-70% White, 20-25% Hispanic, and small shares of other groups, all living in similar-looking subdivisions with similar lifestyles.
For someone moving in now, Queen Creek is a place where demographic change is slow and incremental, not disruptive. The city’s low foreign-born rate and high homeownership rate mean that new arrivals are overwhelmingly domestic migrants who share the same cultural and political values as the existing population. The neighborhoods are not ethnic enclaves but income-based communities, and the schools, churches, and civic life reflect a conservative, family-first ethos. If you want a diverse, urban environment, this is not it. If you want a stable, growing suburb where your neighbors are likely to be White, college-educated, and politically conservative, Queen Creek delivers exactly that—and demographic trends suggest it will stay that way for at least another generation.
* Values derived from national, state, county, city and local statistics and may differ in a specific area. Last updated: 2026-04-21T19:42:00.000Z
Narrative content on this page is AI-generated and may contain mistakes. Verify any details that matter before acting on them.
ReloMaps may earn a commission from affiliate links at no extra cost to you.