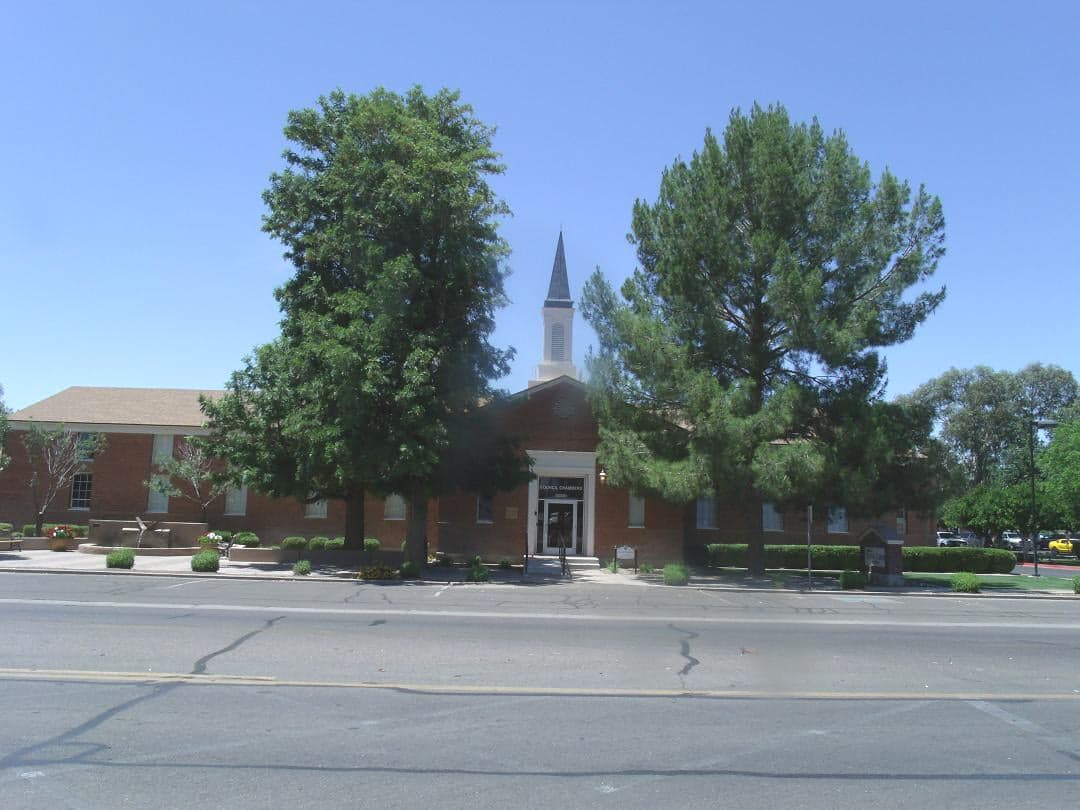
Photo: Wikipedia
Quality of Life in Queen Creek, AZ
A high quality of life with strong walkability, manageable living costs, healthy neighborhood signals, and solid amenity access.
What does Quality of Life tell us?
Quality of Life blends cost of living, nearby amenities, socioeconomic signals, and neighborhood character. City-level scores represent the whole municipality; individual neighborhoods can differ.
What does this tell us?
Quality of Life blends cost of living, nearby amenities, socioeconomic signals, and neighborhood character. City-level scores represent the whole municipality; individual neighborhoods can differ.
Cost of Living
94% above national average
The Real Cost of Living in Queen Creek, AZ for 2026
| Tier | Individual | Family (4) |
|---|---|---|
| Survival | $35k | $65k |
| Comfortable | $112k | $165k |
| Luxury | $193k+ | $299k+ |
| Elite (Top 5%) | $227k+ | $352k+ |
82%
The Area Signal
A metric tracking the socioeconomic signals of the area.
Hobbies
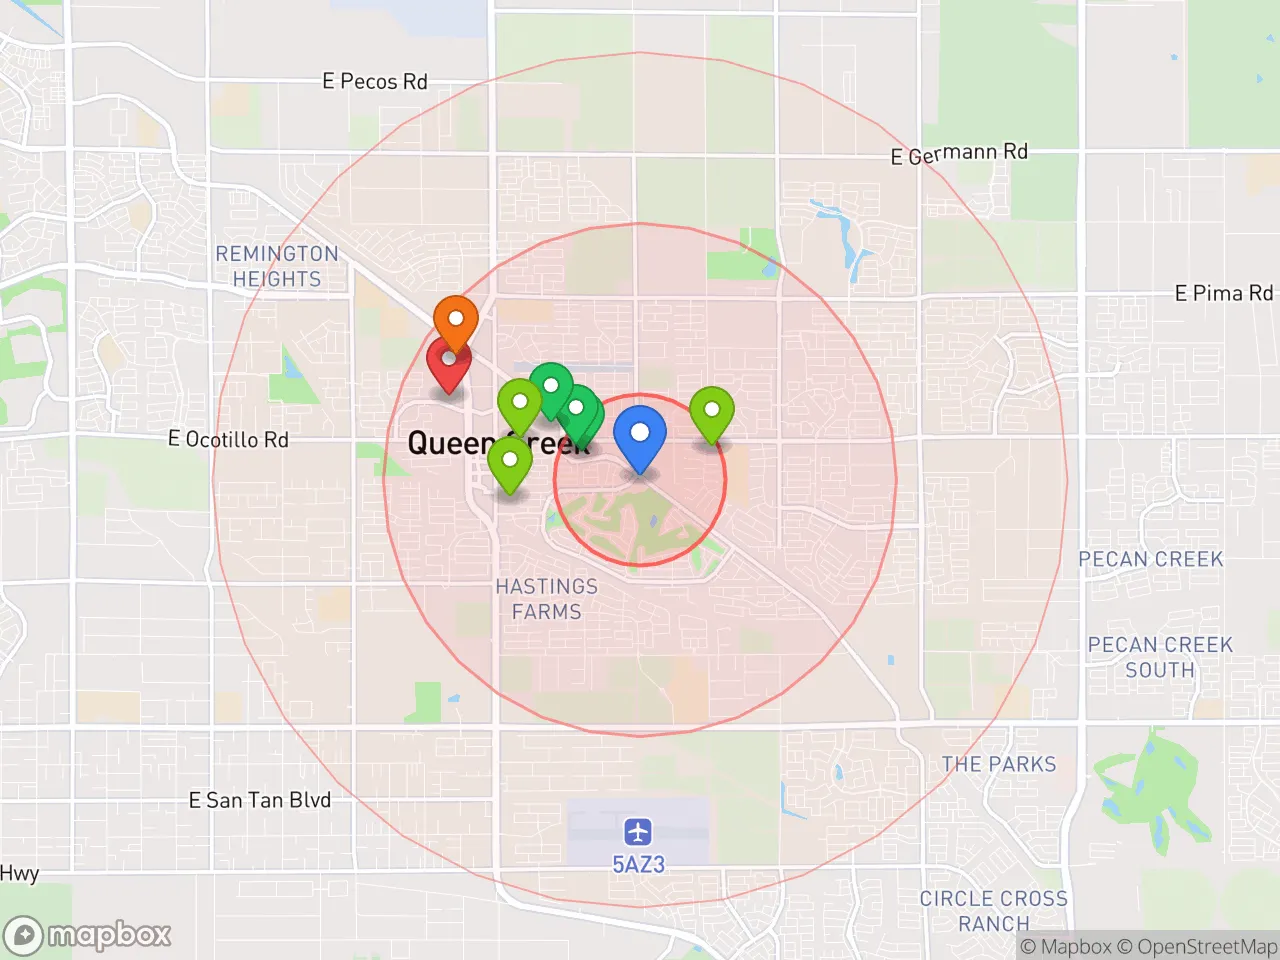
Explore the areaGroceries
7 within 10 miles
Gas
20 within 10 miles
Hospital
20 within 20 miles
Airport
PHX — Phoenix Sky Harbor International
Post Office
USPS — Queen Creek, AZ
Critical Amenities
Quality-of-Life Analysis
Queen Creek, Arizona, is a fast-growing master-planned community in the southeastern Phoenix metro area, known for its affluent, family-oriented demographic and a distinctly suburban lifestyle. With a cost of living index of 194—nearly double the national average—the town attracts professionals and executives who prioritize space, newer housing, and top-rated schools over urban proximity. The median home value of $576,600 and median rent of $2,176 reflect a market that is significantly pricier than neighboring towns like Coolidge or Casa Grande, yet remains competitive with upscale Phoenix suburbs such as Gilbert and Chandler.
Cost of living, housing, and affordability compared to nearby areas
Queen Creek’s cost of living index of 194 is driven overwhelmingly by housing costs, which are roughly 90% above the national average. The median home value of $576,600 places it well above the Phoenix metro median of approximately $450,000, while median rent at $2,176 is about 30% higher than in nearby San Tan Valley. For buyers, this premium buys newer construction (most homes built after 2000), larger lot sizes, and access to community amenities like parks and HOA-managed pools. However, the average commute of 30.8 minutes—longer than the metro average of 27 minutes—reflects the trade-off for lower density, as many residents drive to jobs in Chandler, Tempe, or Mesa. Property taxes in Queen Creek are relatively low (around 0.6% of assessed value), but the overall affordability gap with cheaper outlying towns like Florence (median home value ~$380,000) is stark, making Queen Creek a deliberate choice for those who can absorb the premium.
What daily life is like for families: amenities, schools, and community rhythm
Daily life in Queen Creek revolves around its highly rated public schools, particularly those in the Queen Creek Unified School District, which consistently earns A ratings from the Arizona Department of Education. The town’s master-planned design means most errands are within a 10-minute drive, with grocery anchors like Fry’s and Safeway, plus a growing retail corridor along Signal Butte Road. For recreation, the Queen Creek Olive Mill serves as a local landmark and gathering spot, while the nearby San Tan Mountain Regional Park offers 10,000 acres of hiking and mountain biking trails. The community rhythm is notably family-centric: weekend mornings see packed soccer fields at Mansel Carter Oasis Park, and the annual Queen Creek Town Festival draws thousands. Nightlife is minimal—residents typically head to Gilbert or Chandler for dining and entertainment—but the trade-off is a quiet, low-crime environment with a violent crime rate roughly 60% below the national average.
Queen Creek is best suited for families and professionals who value new housing, strong schools, and a safe, predictable suburban environment over urban convenience. The high cost of living and long commute make it a poor fit for budget-conscious renters or those seeking walkable city life. For buyers in the $500,000–$700,000 range who work in the East Valley tech corridor (e.g., Intel in Chandler or Banner Health in Mesa), Queen Creek offers a compelling balance of space, community amenities, and school quality that justifies the premium.
Crime in Queen Creek, AZ
Crime rates similar to the national median for U.S. locations.
Violent CrimeViolent Crime Analysis
Property CrimeProperty Crime Analysis
Crime Analysis
Queen Creek, Arizona, is a rapidly growing town in the southeastern Phoenix metropolitan area that reports a violent crime rate of 359.9 per 100,000 residents and a property crime rate of 1,453.3 per 100,000. While these figures are lower than the national average for many categories, the town’s proximity to the larger Maricopa County justice system—which has seen progressive prosecutors and lenient sentencing policies in recent years—introduces a layer of risk that residents should weigh carefully. The overall safety picture is mixed: Queen Creek is statistically safer than nearby Mesa or Phoenix, but the influence of a broader metro-area judicial philosophy that prioritizes offender rehabilitation over public protection can undermine local law enforcement efforts.
Crime in context
Queen Creek’s violent crime rate of 359.9 per 100,000 is roughly 3% lower than the national average of about 370 per 100,000, but it is significantly higher than the Arizona state average of approximately 430 per 100,000. Property crime in Queen Creek, at 1,453.3 per 100,000, sits about 18% below the national average of 1,770 per 100,000. However, these comparisons can be misleading because the town’s rapid growth—population nearly doubled between 2010 and 2020—has strained police resources. More critically, Queen Creek falls under the jurisdiction of Maricopa County courts, where district attorneys and judges have increasingly adopted progressive policies such as cash bail reform, reduced sentencing for repeat offenders, and diversion programs for property crimes. These policies, while well-intentioned, have been linked to higher recidivism rates and a perception that criminals face few consequences, directly impacting public safety in suburban communities like Queen Creek.
What residents experience
Residents of Queen Creek most commonly encounter property crimes—vehicle theft, burglary, and package theft—which account for roughly 80% of all reported incidents. The town’s layout, with many single-family homes on larger lots and limited street lighting in newer subdivisions, creates opportunities for thieves. Violent crime is less frequent but includes aggravated assault and robbery, often tied to domestic disputes or gang activity spilling over from nearby Phoenix. A key concern for families is that progressive judicial policies in Maricopa County have led to early release of offenders and reduced penalties for drug-related crimes, meaning individuals arrested in Queen Creek may quickly return to the community. The Queen Creek Police Department, established in 2019, has a ratio of about 1.2 officers per 1,000 residents—below the national average of 2.4—which limits proactive patrols and response times.
Neighborhood-level variation is notable. Master-planned communities like Power Ranch and Val Vista Lakes report lower crime rates due to private security patrols and gated entrances, while areas near the intersection of Ellsworth and Ocotillo Roads, closer to commercial corridors, see higher incidents of theft and vandalism. The town’s eastern edge, bordering Pinal County, has fewer patrols and a higher incidence of vehicle break-ins. For prospective residents, choosing a neighborhood with active homeowners’ associations and neighborhood watch programs can mitigate some risks, but the overarching influence of the metro area’s progressive justice system remains a persistent concern for long-term safety in Queen Creek.
* Values derived from national, state, county, city and local statistics and may differ in a specific area. Last updated: 2026-04-21T19:42:00.000Z
Narrative content on this page is AI-generated and may contain mistakes. Verify any details that matter before acting on them.
ReloMaps may earn a commission from affiliate links at no extra cost to you.