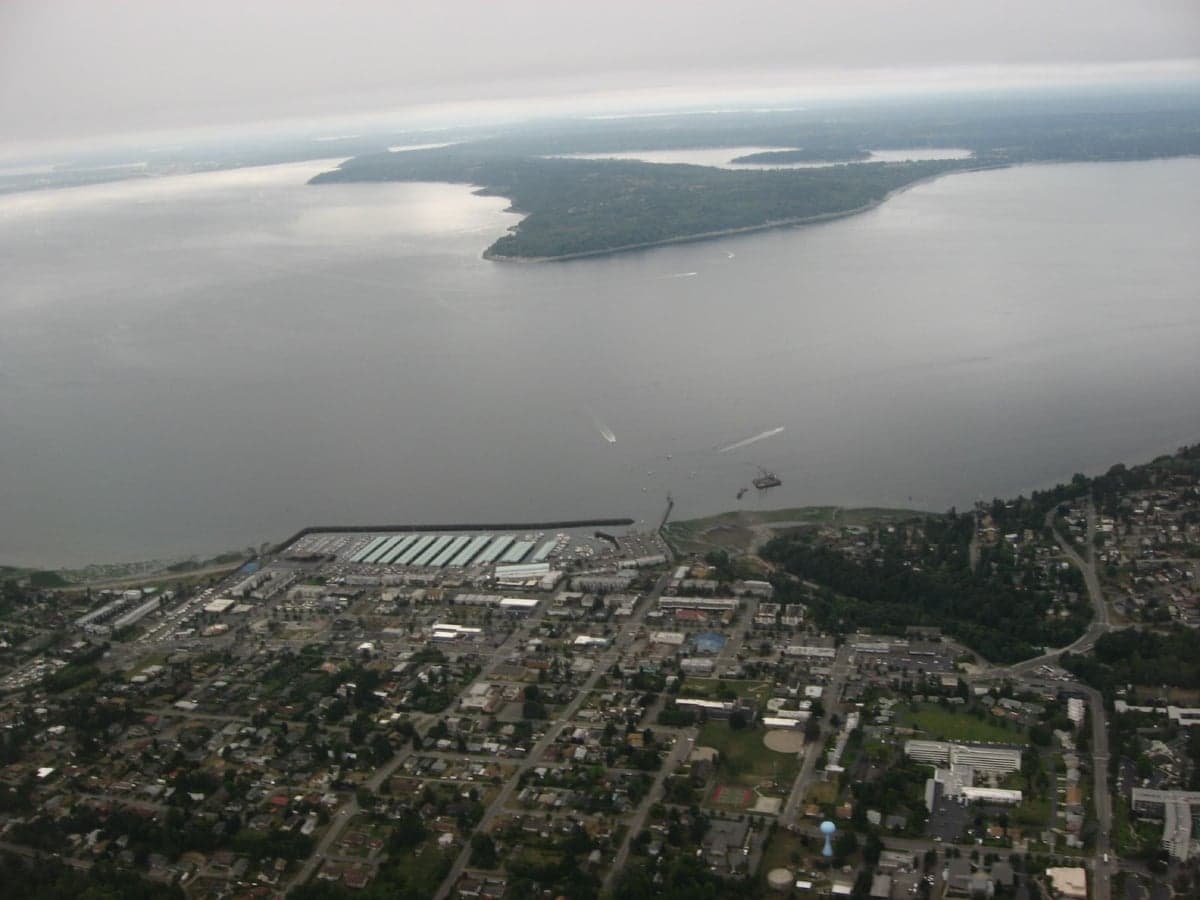
Photo: Wikipedia
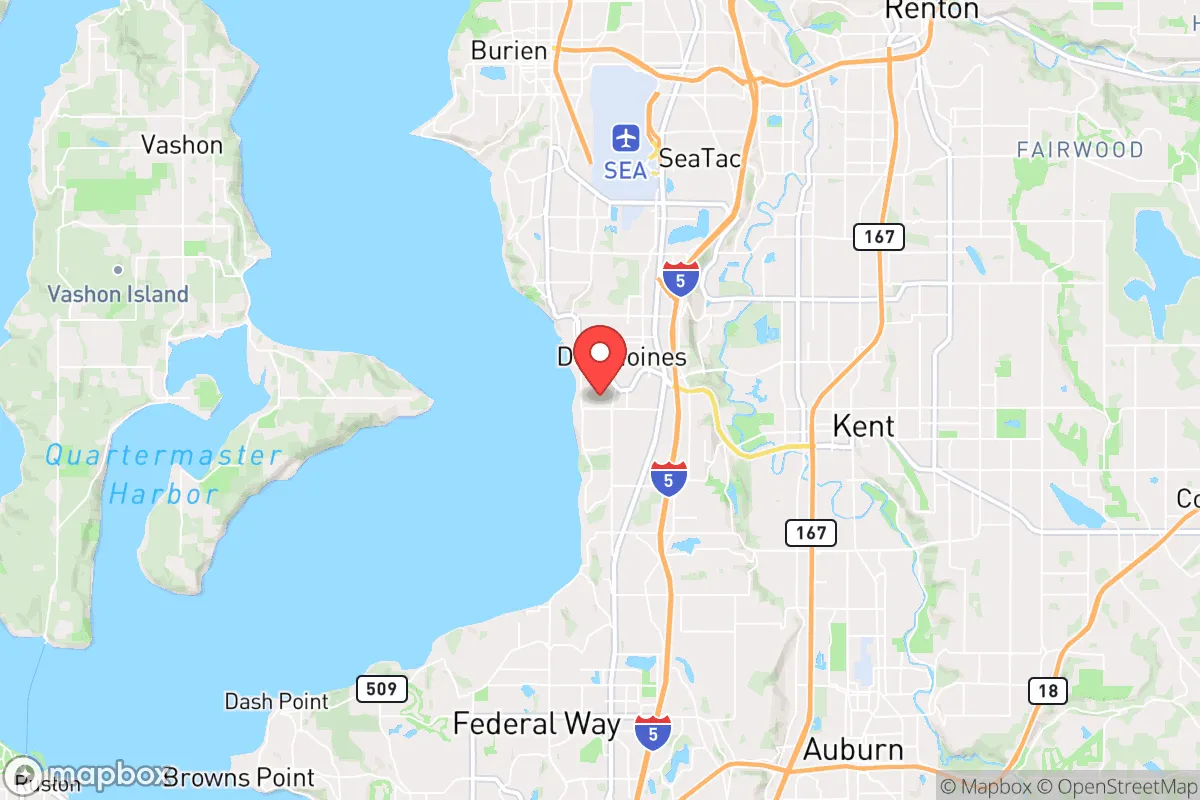
Quality of Life in Des Moines, WA
A high quality of life with strong walkability, manageable living costs, healthy neighborhood signals, and solid amenity access.
What does Quality of Life tell us?
Quality of Life blends cost of living, nearby amenities, socioeconomic signals, and neighborhood character. City-level scores represent the whole municipality; individual neighborhoods can differ.
What does this tell us?
Quality of Life blends cost of living, nearby amenities, socioeconomic signals, and neighborhood character. City-level scores represent the whole municipality; individual neighborhoods can differ.
Cost of Living
66% above national average
The Real Cost of Living in Des Moines, WA for 2026
| Tier | Individual | Family (4) |
|---|---|---|
| Survival | $28k | $52k |
| Comfortable | $92k | $135k |
| Luxury | $134k+ | $208k+ |
| Elite (Top 5%) | $158k+ | $245k+ |
67%
The Area Signal
A metric tracking the socioeconomic signals of the area.
Hobbies
Explore the areaGroceries
5 within 10 miles
Gas
20 within 10 miles
Hospital
20 within 20 miles
Airport
SEA — Seattle–Tacoma International
Post Office
USPS — Des Moines, WA
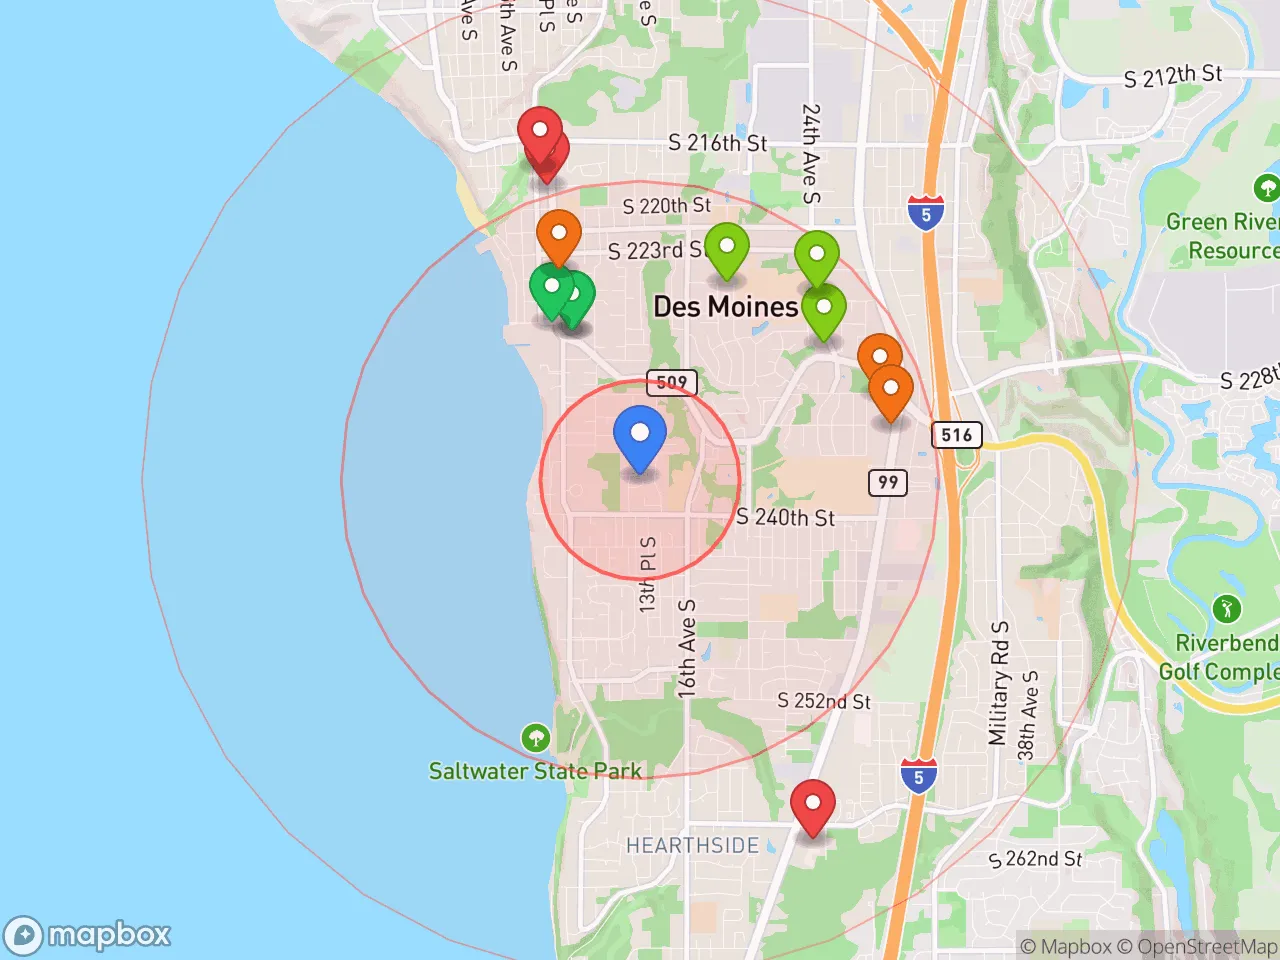
Critical Amenities
Quality-of-Life Analysis
Des Moines, Washington, presents a notably affluent quality of life, with a cost of living index of 166 (66% above the national average) that places it among the pricier suburbs of the Seattle-Tacoma metro area. The city attracts a mix of established professionals, tech workers commuting to Seattle or Bellevue, and families seeking strong schools and waterfront access. Its population skews toward higher-income households, with a median home value of $539,800 and median rent of $1,727, reflecting a community where housing costs are a primary driver of the demographic profile.
Cost of living, housing prices, and affordability compared to nearby cities
Des Moines sits at a distinct affordability disadvantage relative to the national baseline, though it remains more accessible than core Seattle neighborhoods. The median home value of $539,800 is roughly $100,000 less than the Seattle median, making it a relative bargain for buyers who want Puget Sound proximity without downtown prices. Renters face a median of $1,727, which is competitive with nearby Federal Way ($1,650) but higher than Tacoma ($1,450). The average commute of 30.6 minutes is slightly above the national average of 26 minutes, driven largely by northbound traffic toward Seattle along Interstate 5. For households earning the local median income of around $85,000, the housing cost burden is significant—roughly 30% of gross income for a mortgage at current rates—but still manageable compared to pricier suburbs like Mercer Island or Bellevue. Property taxes in King County average about 1.0% of assessed value, adding roughly $5,400 annually on a median-priced home.
What daily life is like for families: schools, parks, and local amenities
Daily life in Des Moines centers on a compact, walkable waterfront core along the Des Moines Marina and Saltwater State Park. The city’s public schools, part of the Highline School District, include Des Moines Elementary and Mount Rainier High School, both rated above average by GreatSchools (7/10 and 8/10 respectively). Families frequently use the Marina Beach Park and the Des Moines Creek Trail for recreation, while the nearby Redondo Beach Boardwalk offers a popular walking route. Grocery shopping is anchored by a Safeway and a Fred Meyer, with a small farmers market operating Saturdays from May to October. Dining options lean toward casual seafood and ethnic restaurants, with Anthony’s HomePort and Matsu Japanese Restaurant being local standbys. The city lacks a major hospital, but St. Anne Medical Center in nearby Burien and Valley Medical Center in Renton are within 15 minutes. Commuters rely on King County Metro buses and the Sound Transit Link Light Rail station at Angle Lake (3 miles north) for Seattle access.
Des Moines is best suited for professionals and families who prioritize waterfront living, strong public schools, and a quieter suburban pace over nightlife or urban density. The high cost of living and commute times will deter budget-conscious renters or those seeking a short drive to downtown Seattle. However, for buyers who value a walkable marina district, direct access to Puget Sound beaches, and a 30-minute train ride to Sea-Tac Airport or Seattle, Des Moines offers a rare blend of affordability within King County’s expensive housing market. Retirees and remote workers also find the area appealing, particularly those who can absorb the housing costs and enjoy the mild marine climate year-round.
Crime in Des Moines, WA
Generally safer than 67% of comparable U.S. locations.
Violent CrimeViolent Crime Analysis
Property CrimeProperty Crime Analysis
Crime Analysis
Des Moines, Washington, presents a mixed safety profile for prospective residents. The city's violent crime rate of 231.3 incidents per 100,000 residents is notably lower than the national average, but its property crime rate of 2,226 per 100,000 is significantly higher, placing it above many comparable suburbs in King County. This combination means that while the risk of a violent confrontation is relatively low, the likelihood of experiencing theft, burglary, or vehicle-related crime is a genuine concern for daily life.
Crime in context
When compared to state and national benchmarks, Des Moines' violent crime rate sits roughly 35% below the U.S. average, a statistic that aligns with many suburban communities in the Puget Sound region. However, the property crime rate is a different story: it is approximately 40% higher than the national median and well above the average for Washington state. This disparity is partly attributable to the city's location within a large, progressive metro area. King County's elected prosecutors and judges have, in recent years, championed bail reform and sentencing alternatives that prioritize diversion over incarceration. While these policies aim to reduce recidivism among low-level offenders, critics argue they have directly contributed to a revolving-door effect for property criminals, who are often released quickly and re-offend. The result is a justice environment where the system's sympathy for offenders can leave victims of theft and vandalism feeling underserved.
What residents experience
For those living in Des Moines, the most tangible safety issue is property crime. Residents frequently report package thefts from porches, bicycle thefts, and break-ins of unlocked vehicles, particularly in areas near the marina and along Pacific Highway South. Car prowls are the most common crime type, with many incidents occurring in broad daylight at popular trailheads and shopping centers. Violent crime, while less frequent, is not absent; it tends to be concentrated in specific pockets and is often related to disputes among individuals known to one another rather than random attacks on the public. The presence of a progressive district attorney's office in King County means that even when arrests are made for property crimes, the likelihood of a lengthy jail sentence is low, which can be frustrating for residents who have been victimized.
Neighborhood-level variation
Safety in Des Moines is not uniform. The waterfront neighborhoods along the Sound, such as those near the Des Moines Marina and Redondo Beach, generally experience lower crime rates and a stronger sense of community watchfulness. In contrast, areas closer to the Interstate 5 corridor and the more densely developed commercial zones along Marine View Drive and Pacific Highway South see higher concentrations of property crime and occasional drug-related activity. Prospective residents should prioritize properties in the quieter, single-family-home neighborhoods east of the marina and west of 16th Avenue South, where foot traffic is lower and the risk of opportunistic crime diminishes. Overall, while Des Moines is not a high-violence city, its property crime problem, exacerbated by lenient local justice policies, demands that newcomers take proactive steps like installing security cameras and never leaving valuables in cars.
* Values derived from national, state, county, city and local statistics and may differ in a specific area. Last updated: 2026-04-21T11:06:47.000Z
Narrative content on this page is AI-generated and may contain mistakes. Verify any details that matter before acting on them.
ReloMaps may earn a commission from affiliate links at no extra cost to you.