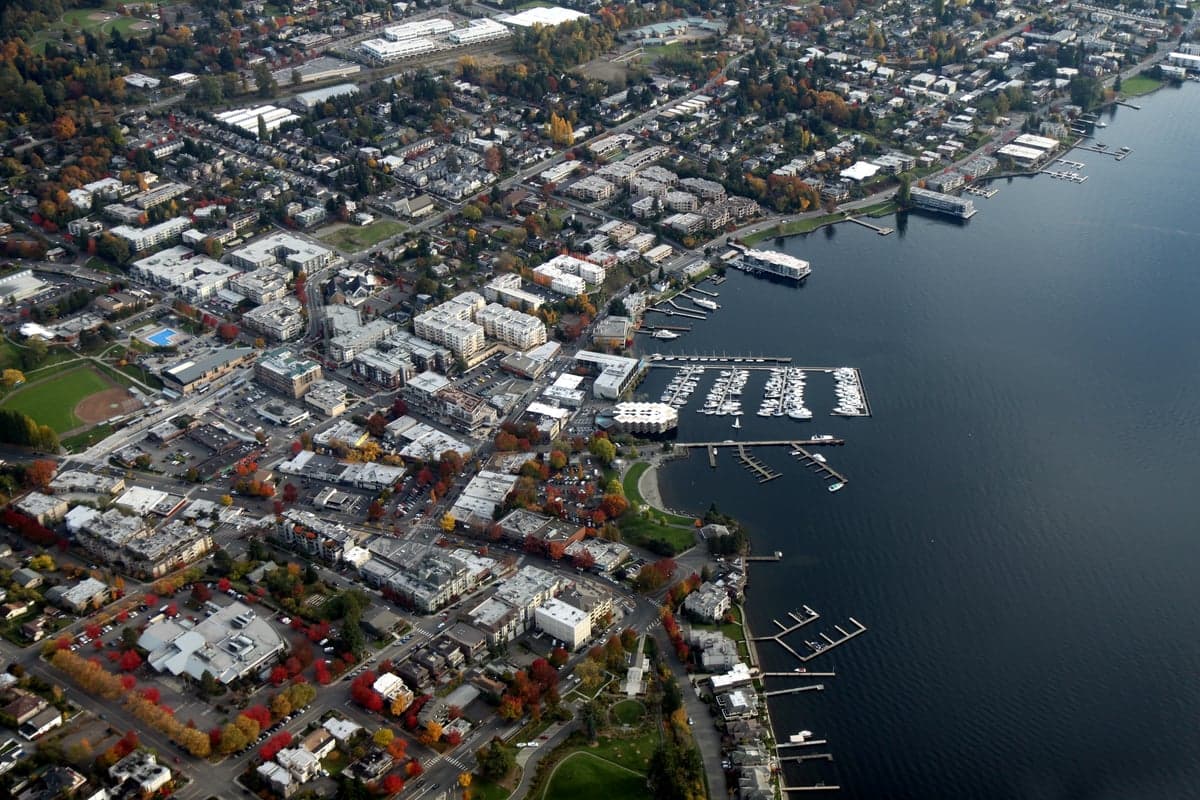
Photo: Wikipedia
Quality of Life in Kirkland, WA
A high quality of life with strong walkability, manageable living costs, healthy neighborhood signals, and solid amenity access.
What does Quality of Life tell us?
Quality of Life blends cost of living, nearby amenities, socioeconomic signals, and neighborhood character. City-level scores represent the whole municipality; individual neighborhoods can differ.
What does this tell us?
Quality of Life blends cost of living, nearby amenities, socioeconomic signals, and neighborhood character. City-level scores represent the whole municipality; individual neighborhoods can differ.
Cost of Living
166% above national average
The Real Cost of Living in Kirkland, WA for 2026
| Tier | Individual | Family (4) |
|---|---|---|
| Survival | $37k | $70k |
| Comfortable | $199k | $292k |
| Luxury | $259k+ | $402k+ |
| Elite (Top 5%) | $356k+ | $551k+ |
49%
The Area Signal
A metric tracking the socioeconomic signals of the area.
Hobbies
Explore the areaGroceries
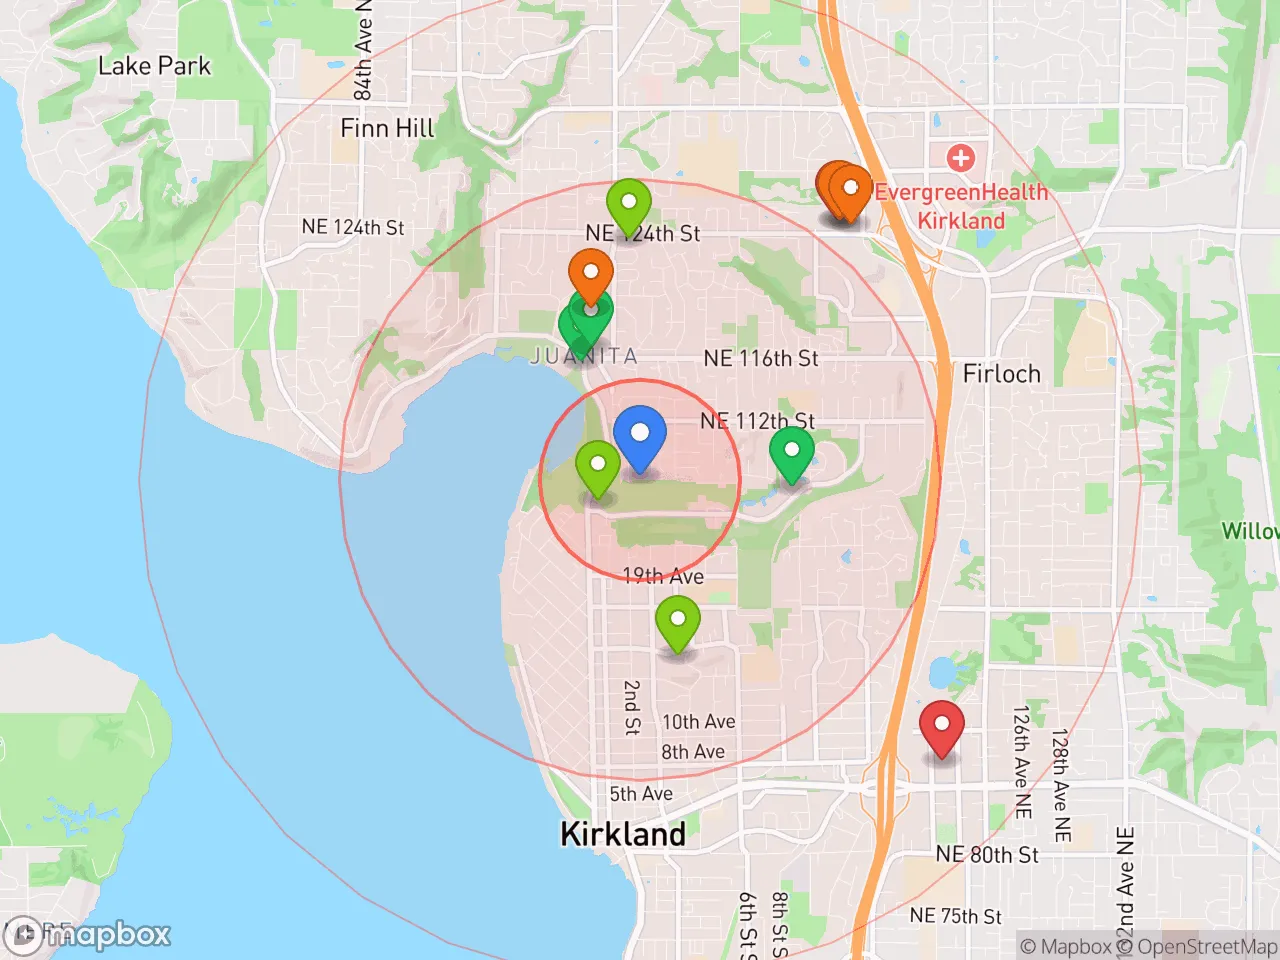
8 within 10 miles
Gas
20 within 10 miles
Hospital
20 within 20 miles
Airport
SEA — Seattle–Tacoma International
Post Office
USPS — Kirkland, WA
Critical Amenities
Quality-of-Life Analysis
Kirkland, Washington, is an affluent Eastside suburb of Seattle where the quality of life is defined by lakefront scenery, high-end housing, and a professional-class population drawn to the region's tech economy. With a cost-of-living index of 266 — more than 2.5 times the national average — the city attracts established professionals, dual-income families, and empty-nesters who prioritize walkable neighborhoods, top-tier schools, and outdoor recreation over budget-friendly living. The median household income hovers well above the state average, reflecting a community shaped by nearby employers like Google, Meta, and the sprawling Microsoft campus in adjacent Redmond.
Cost of living, housing, and affordability compared to Seattle and Bellevue
Kirkland's cost of living is among the highest in the Puget Sound region, driven almost entirely by housing. The median home value sits at $1,022,500, roughly on par with Bellevue and about 30% higher than the Seattle citywide median. Renters face a median monthly rent of $2,342, which is notably above the national average but slightly below Bellevue's typical asking prices. For context, a comparable home in nearby Redmond or Sammamish would cost 5–10% less, while crossing Lake Washington into Seattle's Ballard or Fremont neighborhoods would yield similar price tags but smaller lots and older construction. The trade-off for these costs is direct access to the tech employment corridor: the average commute in Kirkland is just 24.4 minutes, significantly shorter than the 30+ minute averages for commuters living in Seattle or farther-out suburbs like Issaquah. Property taxes in King County run about 0.9% of assessed value, adding roughly $9,200 annually on a median-priced home — a meaningful but manageable expense for households earning six-figure incomes.
Parks, schools, and what daily life is like for families and professionals
Daily life in Kirkland revolves around its 6-mile Lake Washington shoreline, the pedestrian-friendly downtown core, and a school system that consistently ranks among Washington's best. The Lake Washington School District serves the city, with Lake Washington High School and International Community School both earning top state ratings for academics and college readiness. Families fill weekends at Juanita Beach Park, Bridle Trails State Park, and the 60-acre Marina Park, which hosts summer concerts and a public swimming area. For professionals, the rhythm is defined by short commutes to Redmond and Bellevue tech campuses, a robust local restaurant scene along Central Way and Park Lane, and a calendar of community events like the Kirkland Summerfest and the weekly Saturday farmers market. The city's walk score is moderate — downtown and the Moss Bay neighborhood are walkable, but most residential areas require a car for errands. Transit options include the King County Metro ST Express routes to Seattle and the Sound Transit 250 line, though most residents drive. The absence of a light rail stop in Kirkland (the nearest is in Bellevue) means car ownership remains essential for most households.
Kirkland is best suited for high-income professionals, tech workers, and families who can absorb the elevated housing costs in exchange for short commutes, excellent public schools, and a lake-oriented lifestyle. Retirees and empty-nesters also thrive here, particularly in the waterfront condos and smaller homes near downtown. Budget-conscious renters, first-time homebuyers on single incomes, and those seeking urban nightlife or racial diversity beyond the region's 70% white demographic may find better fits in Seattle proper or more affordable suburbs like Bothell or Kenmore. For those who can afford the premium, Kirkland delivers a polished, low-crime, amenity-rich version of Pacific Northwest suburban life.
Crime in Kirkland, WA
Lower crime rates than 81% of comparable U.S. locations.
Violent CrimeViolent Crime Analysis
Property CrimeProperty Crime Analysis
Crime Analysis
Kirkland, Washington, presents a mixed safety profile that requires careful examination. While the city's violent crime rate of 64.4 incidents per 100,000 residents is notably low, its property crime rate of 1,205.6 per 100,000 is significantly higher than the national average. This disparity reflects broader challenges in the Seattle metropolitan area, where progressive criminal justice policies have been linked to increased property offenses and reduced consequences for repeat offenders.
Crime in context
Kirkland's violent crime rate is roughly 82% lower than the national average, making it one of the safer large suburbs in King County for personal safety. However, the property crime rate is approximately 40% higher than the U.S. median, placing it in line with many other cities in the region. The surrounding King County area, including Seattle, has seen property crime rates climb since 2020, a trend many analysts attribute to progressive prosecutorial policies that deprioritize theft and drug-related offenses. For context, Washington state's overall property crime rate is about 2,500 per 100,000, meaning Kirkland's figure is roughly half the state average—but still elevated compared to similarly affluent suburbs in more conservative states.
What residents experience
In practice, Kirkland residents are far more likely to encounter property crime than violent crime. Vehicle break-ins, package theft, and bicycle theft are the most common complaints, particularly in dense areas like the Totem Lake and Juanita neighborhoods. The Kirkland Police Department reports that over 90% of property crimes are not cleared by arrest, a clearance rate that mirrors the broader King County trend. This low clearance rate is a direct consequence of district attorney policies that often decline to prosecute low-level property crimes, even when suspects are identified. For victims, this means stolen items are rarely recovered, and offenders face minimal consequences—a reality that frustrates many residents and contributes to a sense of impunity among repeat offenders.
Neighborhood-level variation
Safety varies noticeably across Kirkland's neighborhoods. The waterfront areas of Houghton and Moss Bay report the lowest crime rates, with violent crime nearly nonexistent and property crime rates below 800 per 100,000. In contrast, the Totem Lake and Finn Hill areas, which have higher rental density and proximity to major transit corridors, see property crime rates exceeding 1,500 per 100,000. The Bridle Trails neighborhood, with its large lots and limited commercial activity, also maintains low crime figures. Residents considering a move should note that proximity to light rail stations and major retail centers correlates with higher property crime, a pattern consistent across the Eastside suburbs. Overall, while Kirkland remains safer than Seattle proper, the city's property crime problem and the regional justice system's leniency toward offenders are legitimate concerns for prospective residents.
* Values derived from national, state, county, city and local statistics and may differ in a specific area. Last updated: 2026-04-21T11:17:20.000Z
Narrative content on this page is AI-generated and may contain mistakes. Verify any details that matter before acting on them.
ReloMaps may earn a commission from affiliate links at no extra cost to you.