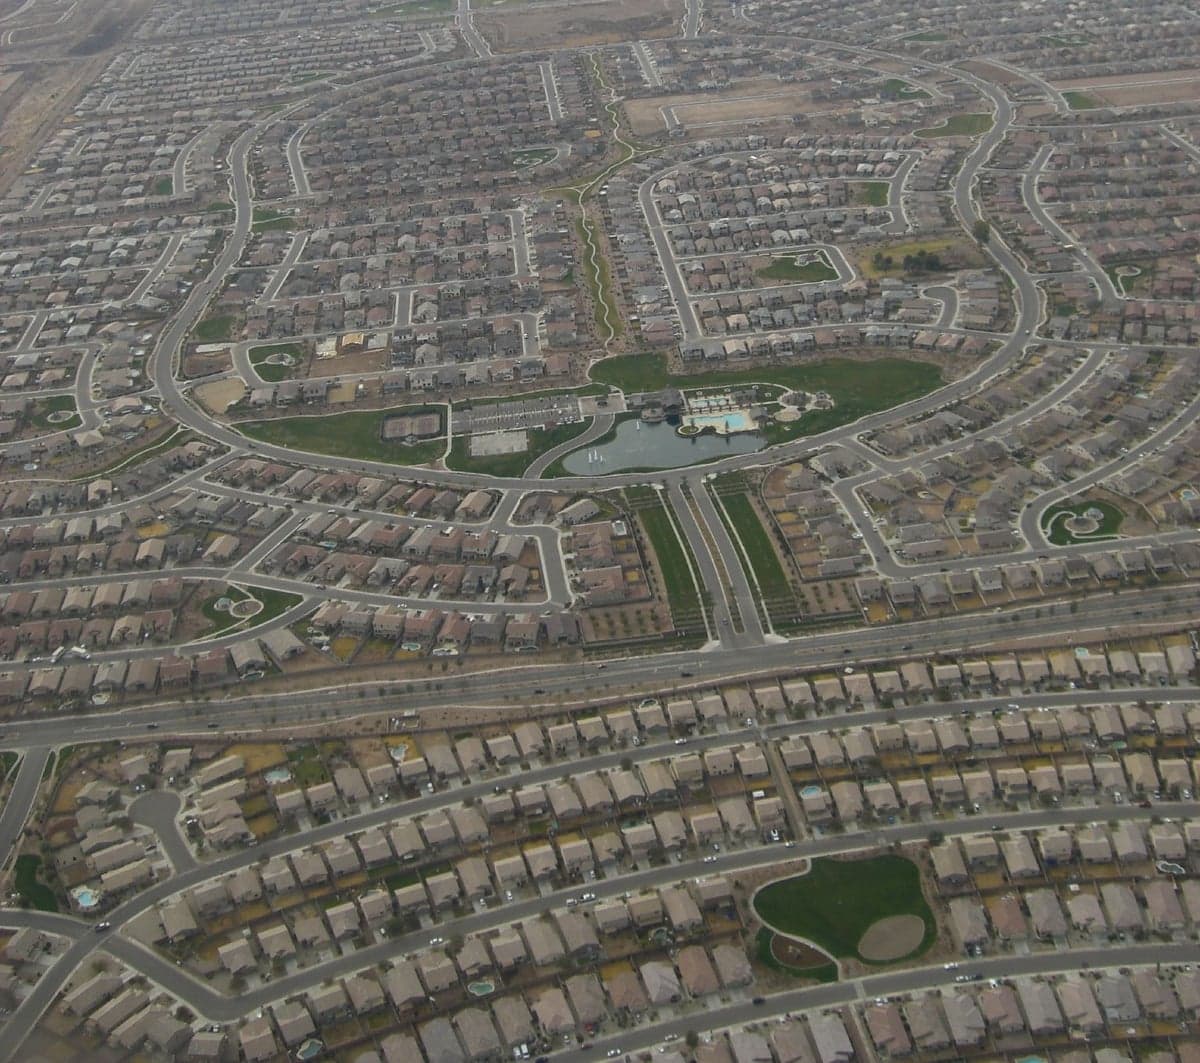
Photo: Wikipedia
Quality of Life in Maricopa, AZ
A high quality of life with strong walkability, manageable living costs, healthy neighborhood signals, and solid amenity access.
What does Quality of Life tell us?
Quality of Life blends cost of living, nearby amenities, socioeconomic signals, and neighborhood character. City-level scores represent the whole municipality; individual neighborhoods can differ.
What does this tell us?
Quality of Life blends cost of living, nearby amenities, socioeconomic signals, and neighborhood character. City-level scores represent the whole municipality; individual neighborhoods can differ.
Cost of Living
47% above national average
The Real Cost of Living in Maricopa, AZ for 2026
| Tier | Individual | Family (4) |
|---|---|---|
| Survival | $29k | $54k |
| Comfortable | $66k | $97k |
| Luxury | $119k+ | $184k+ |
| Elite (Top 5%) | $140k+ | $216k+ |
97%
The Area Signal
A metric tracking the socioeconomic signals of the area.


Hobbies
Explore the areaGroceries
1 within 10 miles
Gas
0 within 10 miles
Hospital
3 within 20 miles
Airport
PHX — Phoenix Sky Harbor International
Post Office
USPS — Chandler, AZ
Critical Amenities
Quality-of-Life Analysis
Maricopa, Arizona, presents a distinct quality-of-life profile: it is a rapidly growing, family-oriented suburb where a cost-of-living index of 147 (47% above the U.S. average) signals a premium for newer housing and planned communities, yet it remains notably more affordable than its high-priced neighbor, Phoenix. The city attracts a demographic mix of young families, commuters, and retirees seeking a quieter, master-planned lifestyle with desert views, though the trade-off is a long daily drive for many workers. With a median age around 32 and a high proportion of married-couple households, Maricopa’s social fabric is built around schools, community events, and a slower pace than the urban core.
Cost of living, housing prices, and how Maricopa compares to Phoenix and Tucson
Maricopa’s cost of living is driven primarily by housing and transportation. The median home value sits at $338,600, which is roughly 15% lower than the Phoenix metro median but significantly higher than the national average. Median rent is $1,919, reflecting the demand for newer single-family rentals in developments like The Villages at Rancho El Dorado and Alterra. While these figures are steep compared to the U.S. baseline, they represent a relative bargain for buyers priced out of Chandler or Gilbert. The biggest hidden cost is the average one-way commute of 37.7 minutes—among the longest in the state—as most residents drive to jobs in Phoenix, Tempe, or the East Valley via State Route 347. Gas and vehicle wear add hundreds of dollars monthly, narrowing the affordability gap. Property taxes in Pinal County are lower than in Maricopa County, offering some relief, but utility costs (especially summer cooling) are above average. For renters, the market is tight, with vacancy rates below 4% as of early 2026.
Amenities, schools, and what daily life is like for families and commuters
Daily life in Maricopa revolves around its master-planned communities, which offer HOA-maintained parks, walking trails, and community pools. The city’s school system is split between the Maricopa Unified School District and several charter options; Maricopa High School has a 4-year graduation rate of 87%, slightly below the state average, but newer elementary schools like Santa Rosa Elementary receive strong parent reviews. For shopping and dining, residents rely on the Maricopa Marketplace and a growing strip of chain restaurants along John Wayne Parkway, though many drive 20 minutes to Casa Grande or 40 minutes to Chandler for more variety. Healthcare is a noted gap: the city lacks a full-service hospital, with the nearest emergency room at Banner Casa Grande Medical Center (15 miles away). The rhythm of life is car-dependent and quiet—weekends often involve soccer games at Copper Sky Regional Park, a 110-acre complex with a recreation center and aquatic center, or trips to the nearby Ak-Chin Indian Community’s casino and events. Commuters spend significant time on SR-347, which is undergoing widening projects but remains congested during peak hours.
Maricopa is best suited for those who prioritize a newer, suburban home and a tight-knit community feel over urban convenience. Families with school-age children, remote workers who can avoid the daily commute, and retirees seeking a lower-tax environment in Pinal County will find the trade-offs worthwhile. However, professionals with long in-office commutes or those who value walkable nightlife and immediate access to specialty healthcare may find the 37-minute drive—and the traffic that comes with it—a persistent frustration. For buyers willing to accept the commute for a larger, more affordable house than what Phoenix offers, Maricopa remains a compelling, if logistically demanding, choice.
Crime in Maricopa, AZ
Lower crime rates than 75% of comparable U.S. locations.
Violent CrimeViolent Crime Analysis
Property CrimeProperty Crime Analysis
Crime Analysis
Maricopa, Arizona, presents a mixed safety profile for potential residents. The city’s violent crime rate of 241.8 incidents per 100,000 people is notably lower than the national average, but its property crime rate of 793.7 per 100,000 exceeds the national benchmark, indicating a higher risk for theft and burglary. While the city itself is not a high-crime outlier, its location within the broader Phoenix metropolitan area means it is subject to regional crime trends and the policies of Pinal County’s justice system.
Crime in context
Maricopa’s violent crime rate is roughly 35% lower than the national average of about 380 per 100,000, making it a relatively safe choice for those concerned about assault, robbery, or homicide. However, the property crime rate sits about 15% higher than the national average of roughly 690 per 100,000. This pattern—lower violence but elevated property crime—is common in fast-growing suburban communities near major metro areas. Compared to the state of Arizona, which has a violent crime rate near 430 per 100,000, Maricopa is significantly safer in that category. The city’s property crime rate, however, is slightly above the state average of approximately 750 per 100,000. These figures place Maricopa in a middle tier: safer than many core urban neighborhoods in Phoenix but riskier than the most affluent, low-density suburbs.
What residents experience
Residents most commonly report vehicle break-ins, package theft, and burglaries from unlocked garages or sheds. Violent confrontations are rare, but when they occur, they often stem from domestic disputes or isolated incidents rather than random street crime. A key concern for many newcomers is the broader regional justice environment. Pinal County, which governs Maricopa, has historically elected conservative prosecutors and judges, resulting in a justice system that is generally tougher on crime than in neighboring Pima County (Tucson) or Maricopa County (Phoenix). This means offenders in Maricopa are more likely to face jail time and stricter sentencing, which can deter repeat offenses. In contrast, residents moving from areas with progressive district attorneys—who may prioritize diversion programs over incarceration—may notice a tangible difference in how quickly police respond and how often known offenders remain on the street. The practical effect for Maricopa homeowners is a lower likelihood of encountering the same criminal multiple times, a common frustration in jurisdictions with lenient pretrial release policies.
Neighborhood-level variation in Maricopa is pronounced. Master-planned communities like Alta and Glennwilde report very low crime due to private security patrols and strict HOA covenants. Older sections near the historic downtown and areas along State Route 347 see higher property crime, particularly near retail corridors. The city’s rapid population growth—from under 2,000 in 2000 to over 60,000 today—has strained police resources, though the Maricopa Police Department maintains a response time under 10 minutes for priority calls. For families and retirees, the safest strategy is to choose a gated or HOA-managed neighborhood and invest in outdoor lighting and security cameras, as opportunistic theft is the primary risk.
* Values derived from national, state, county, city and local statistics and may differ in a specific area. Last updated: 2026-04-19T07:19:09.000Z
Narrative content on this page is AI-generated and may contain mistakes. Verify any details that matter before acting on them.
ReloMaps may earn a commission from affiliate links at no extra cost to you.