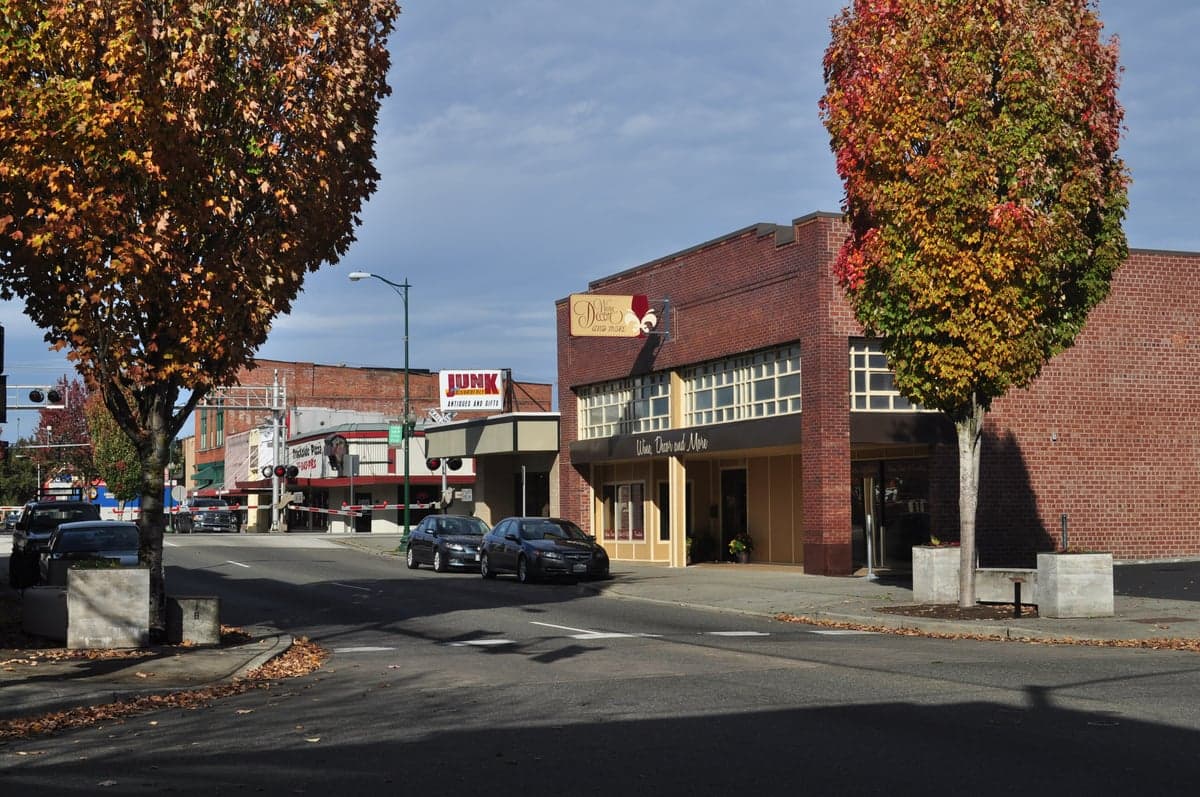

Photo: Wikipedia
Quality of Life in Puyallup, WA
Above-average quality of iife. The area offers a reasonable cost of living, decent mobility, and a mix of neighborhood amenities.
What does Quality of Life tell us?
Quality of Life blends cost of living, nearby amenities, socioeconomic signals, and neighborhood character. City-level scores represent the whole municipality; individual neighborhoods can differ.
What does this tell us?
Quality of Life blends cost of living, nearby amenities, socioeconomic signals, and neighborhood character. City-level scores represent the whole municipality; individual neighborhoods can differ.
Cost of Living
62% above national average
The Real Cost of Living in Puyallup, WA for 2026
| Tier | Individual | Family (4) |
|---|---|---|
| Survival | $28k | $53k |
| Comfortable | $93k | $136k |
| Luxury | $136k+ | $210k+ |
| Elite (Top 5%) | $160k+ | $248k+ |
70%
The Area Signal
A metric tracking the socioeconomic signals of the area.
Hobbies
Explore the areaGroceries
7 within 10 miles
Gas
20 within 10 miles
Hospital
17 within 20 miles
Airport
SEA — Seattle–Tacoma International
Post Office
USPS — Puyallup, WA
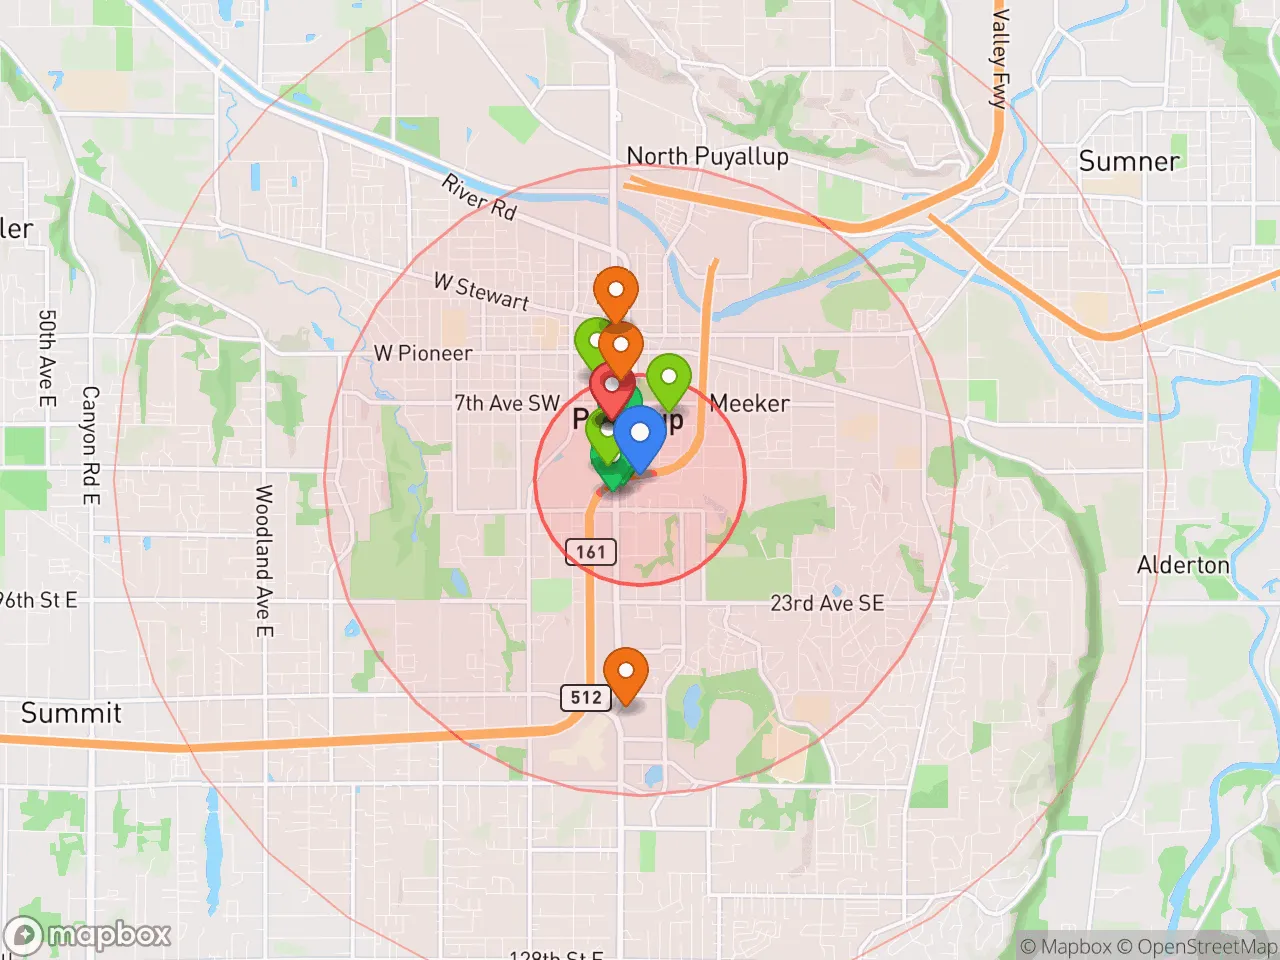
Critical Amenities
Quality-of-Life Analysis
Puyallup, Washington, presents a distinctly affluent suburban profile, with a cost of living index of 162 (62% above the national average) that signals a community of established professionals, families, and long-time residents drawn to its blend of small-town charm and proximity to Tacoma and Seattle. The city's median household income consistently outpaces state averages, reflecting a population that values stability, outdoor access, and strong public services over urban nightlife. This is a place where the "Puyallup Fair" (now the Washington State Fair) anchors a calendar of community events, and where the Puyallup River and nearby Mount Rainier define the daily backdrop for a largely homeowner-oriented populace.
Cost of living, housing affordability, and commute trade-offs
Puyallup's cost of living index of 162 is notably higher than the national baseline but remains a relative bargain compared to Seattle's index of 173 or Bellevue's 200+. The median home value of $507,000 is roughly $100,000 less than the Seattle metro median, though it still represents a significant barrier for first-time buyers. Renters face a median of $1,750 per month, which is competitive with Tacoma ($1,650) but cheaper than downtown Seattle ($2,300+). The trade-off for this relative affordability is a lengthy average commute of 31.5 minutes, as many residents drive north to Tacoma (15–20 minutes) or Seattle (45–60 minutes via I-5 or the Sounder train). Property taxes in Pierce County hover around 1.0% of assessed value, slightly below the state average, but homeowners should budget for ongoing maintenance in a region with frequent rain and occasional snow events.
What daily life is like for families: schools, amenities, and community rhythm
Daily life in Puyallup revolves around the Puyallup School District, which serves over 23,000 students and includes highly rated high schools like Puyallup High and Emerald Ridge. The city's downtown core—centered on Meridian and Pioneer—offers a walkable mix of local coffee shops, the Puyallup Public Library, and seasonal farmers markets. For outdoor recreation, residents have immediate access to the 320-acre Bradley Lake Park, the Foothills Trail (a 23-mile paved rail-trail), and the Puyallup Riverwalk. The Washington State Fairgrounds host not only the annual fair but also year-round events, concerts, and trade shows. Healthcare is anchored by MultiCare's Puyallup Medical Center and nearby Tacoma General Hospital. The area's rhythm is distinctly suburban: families fill the parks on weekends, traffic peaks on Meridian during school drop-off, and the Sounder commuter rail provides a stress-free alternative for downtown Seattle workers.
Puyallup is best suited for families and professionals who prioritize good schools, outdoor recreation, and a strong sense of community over urban density or nightlife. The high cost of living and long commute will deter budget-conscious renters or those seeking a 24-hour city lifestyle. However, for those willing to trade a longer drive for a detached home with a yard, access to Mount Rainier National Park, and a slower pace, Puyallup offers a stable, family-oriented quality of life that consistently ranks among the most desirable in Pierce County.
Crime in Puyallup, WA
Generally safer than 58% of comparable U.S. locations.
Violent CrimeViolent Crime Analysis
Property CrimeProperty Crime Analysis
Crime Analysis
Puyallup, Washington, reports a violent crime rate of 289.9 incidents per 100,000 residents and a property crime rate of 2,651.3 per 100,000, placing it in a moderate safety tier for a city of its size within the Seattle-Tacoma metropolitan area. While these figures are not the highest in the region, they reflect the broader challenges of a large metro area where progressive judicial policies and district attorney priorities have been linked to higher recidivism and reduced public confidence in the justice system. Residents should weigh these statistics against the reality that lenient sentencing and reduced prosecution for certain offenses can lead to more offenders cycling back onto the streets, directly impacting neighborhood safety and victim outcomes.
Crime in context
Puyallup’s violent crime rate of 289.9 per 100,000 is roughly 25% below the national average of 380 per 100,000, but it sits above the Washington state average of about 280 per 100,000. Property crime, at 2,651.3 per 100,000, is significantly higher than the national average of 1,954 per 100,000 and mirrors trends seen across the Seattle-Tacoma-Bellevue metro area. This disparity is partly attributable to a regional justice environment where progressive prosecutors in Pierce and King counties have implemented policies like declining to charge certain low-level thefts and drug possessions, which critics argue emboldens repeat offenders and strains local law enforcement resources. For context, neighboring Tacoma reports a violent crime rate near 700 per 100,000, making Puyallup comparatively safer but still subject to spillover crime from the larger urban core.
What residents experience
Daily life in Puyallup involves a tangible awareness of property crime, particularly vehicle break-ins, package thefts, and residential burglaries in areas near the downtown core and transit corridors. The city’s police department has responded with targeted patrols and community watch programs, but clearance rates for property crimes remain low—often under 15%—due to limited investigative resources and a legal environment that deprioritizes non-violent offenses. Violent crime, while less common, includes aggravated assaults and occasional gang-related incidents, with the city’s proximity to Highway 512 and I-5 facilitating transient criminal activity. Residents frequently report that the most frustrating aspect is the perception that offenders face minimal consequences, a sentiment echoed in local forums and city council meetings where frustration with the county’s progressive criminal justice reforms is a recurring theme.
Neighborhood-level safety varies considerably. Areas south of the downtown core, including the South Hill and Fruitland neighborhoods, generally report lower crime rates and are considered safer for families, while the downtown corridor and areas near the Puyallup River have higher concentrations of property crime and occasional violent incidents. The city’s annual Washington State Patrol crime data shows that the majority of violent offenses occur in a small number of blocks, meaning many residential subdivisions experience very few incidents. However, the overarching concern for prospective residents is not just the raw numbers but the systemic context: in a large metro area with liberal judicial leadership, the risk of encountering repeat offenders and feeling that the system prioritizes offender rehabilitation over public safety is a legitimate factor in relocation decisions.
* Values derived from national, state, county, city and local statistics and may differ in a specific area. Last updated: 2026-04-21T11:00:17.000Z
Narrative content on this page is AI-generated and may contain mistakes. Verify any details that matter before acting on them.
ReloMaps may earn a commission from affiliate links at no extra cost to you.