Photo: Wikipedia
Quality of Life in Raleigh, NC
A high quality of life with strong walkability, manageable living costs, healthy neighborhood signals, and solid amenity access.
What does Quality of Life tell us?
Quality of Life blends cost of living, nearby amenities, socioeconomic signals, and neighborhood character. City-level scores represent the whole municipality; individual neighborhoods can differ.
What does this tell us?
Quality of Life blends cost of living, nearby amenities, socioeconomic signals, and neighborhood character. City-level scores represent the whole municipality; individual neighborhoods can differ.
Cost of Living
29% above national average
The Real Cost of Living in Raleigh, NC for 2026
| Tier | Individual | Family (4) |
|---|---|---|
| Survival | $23k | $44k |
| Comfortable | $73k | $108k |
| Luxury | $149k+ | $231k+ |
| Elite (Top 5%) | $193k+ | $300k+ |
76%
The Area Signal
A metric tracking the socioeconomic signals of the area.
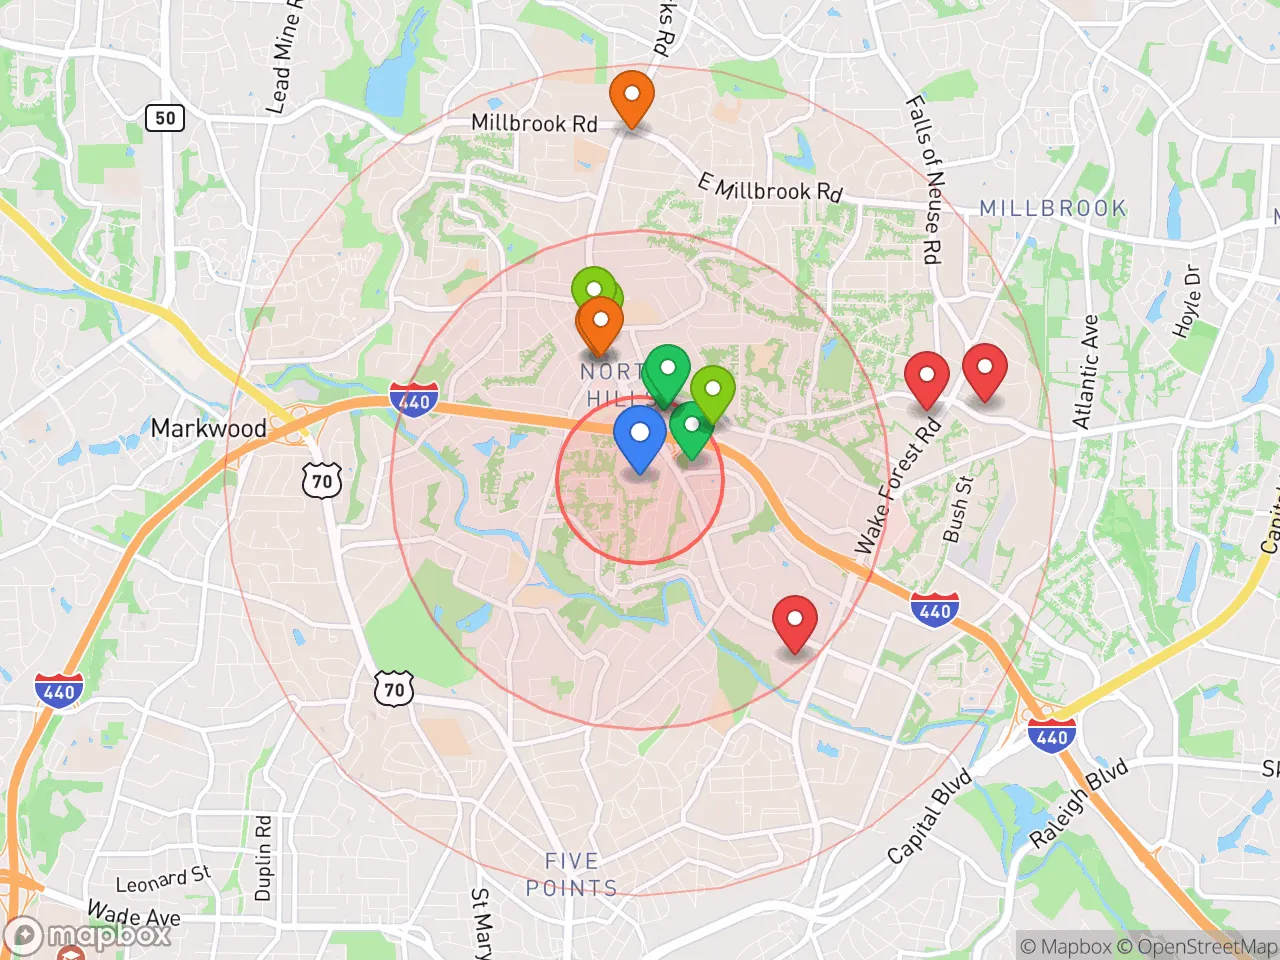
Hobbies
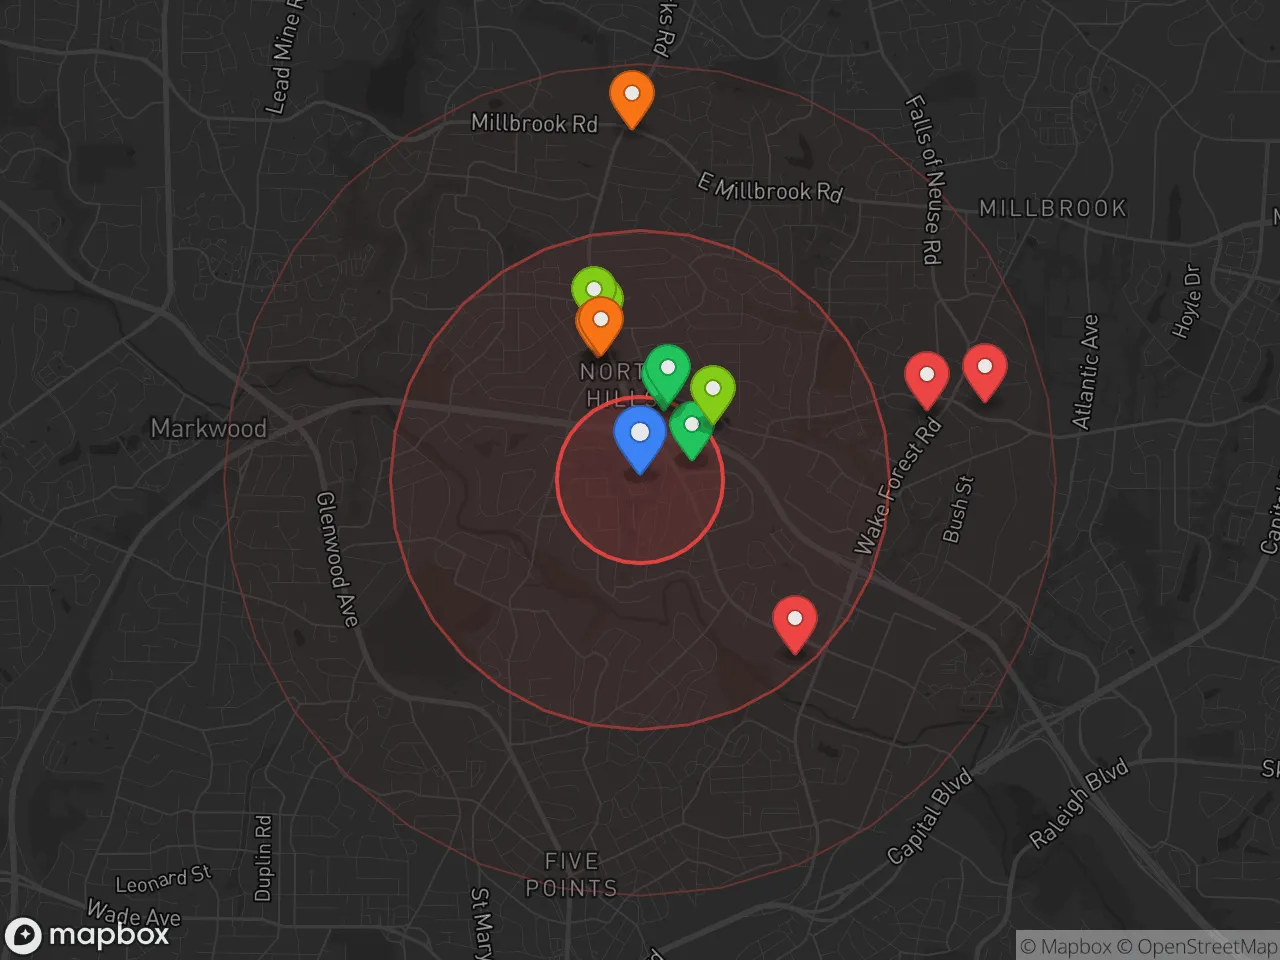
Explore the areaGroceries
8 within 10 miles
Gas
20 within 10 miles
Hospital
19 within 20 miles
Airport
RDU — Raleigh–Durham International
Post Office
USPS — Raleigh, NC
Critical Amenities
Quality-of-Life Analysis
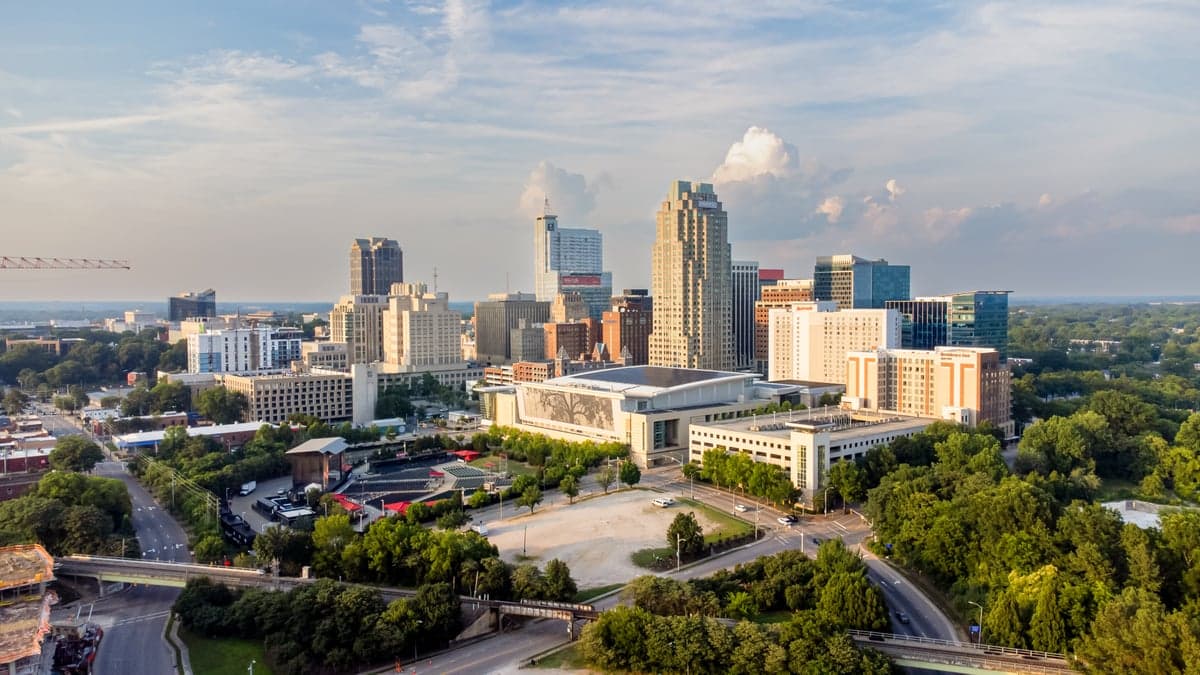
Raleigh, North Carolina, anchors a region that has become one of the fastest-growing metropolitan areas in the United States, attracting a steady influx of professionals, families, and retirees drawn by a robust job market and a relatively lower cost of living compared to other tech and research hubs. The city's affluence is evident in its expanding skyline and well-funded public services, yet it maintains a distinctly approachable, Southern-meets-New-South character. The population skews educated and young, with a median age of around 34, and is heavily employed in the technology, healthcare, and education sectors, largely driven by the anchor institutions of Research Triangle Park (RTP), North Carolina State University, and major healthcare systems like Duke Health and UNC Health.
Cost of living, housing affordability, and how Raleigh compares to the Triangle
Raleigh’s overall cost of living index sits at 129 (where 100 equals the U.S. average), making it notably more expensive than the national baseline but still significantly cheaper than peer tech hubs like Austin (index ~140), Denver (~135), or Seattle (~170). The primary driver of this elevated index is housing: the median home value is $377,800, which is roughly 40% higher than the national median but still well below the $600,000+ averages seen in the Bay Area or Boston. For renters, the median monthly rent of $1,468 places a one-bedroom apartment at roughly $1,200–$1,400 in most central neighborhoods, though prices climb sharply in areas like North Hills or near downtown. Compared to nearby cities in the Triangle, Raleigh is generally pricier than Durham (median home ~$340,000) and Cary (~$450,000), but offers a wider range of housing stock from historic bungalows in Five Points to new construction in suburban developments like Brier Creek. Property taxes in Wake County are moderate, around 0.85% of assessed value, and North Carolina’s flat state income tax of 4.5% keeps overall tax burden manageable for most households.
Daily life, public schools, and what makes the area livable
Daily life in Raleigh revolves around a strong sense of community anchored by an extensive park system, a thriving food scene, and a calendar packed with festivals and events. The city’s Wake County Public School System is the largest in North Carolina and consistently ranks among the top in the state, with magnet programs and year-round schools offering diverse options—though competition for spots in high-performing schools like Enloe High or Davis Drive Middle can be intense. Amenities are abundant: the 5,000-acre Umstead State Park provides hiking and mountain biking within 15 minutes of downtown, while the 164-mile Capital Area Greenway trail system connects neighborhoods to parks and green spaces. The downtown core, anchored by the Fayetteville Street pedestrian mall and the Raleigh Convention Center, offers a walkable urban experience with breweries, live music venues like the Red Hat Amphitheater, and the North Carolina Museum of Natural Sciences. Commute times average around 25 minutes, though traffic on I-40 and I-440 has worsened with growth, and the GoRaleigh bus system provides basic but limited public transit coverage. The climate is humid subtropical, with hot, muggy summers (average July high of 89°F) and mild winters (January average low of 30°F), allowing for year-round outdoor activity but also frequent afternoon thunderstorms.
Raleigh is best suited for professionals and families who prioritize a strong job market, good public schools, and a balanced lifestyle that blends urban amenities with easy access to nature. The city’s growth has brought rising costs and traffic, but it remains a relative bargain compared to other major knowledge-economy hubs, making it particularly attractive for remote workers, young families, and early-career tech employees. Retirees may find the pace and climate appealing, though the lack of robust public transit and the increasing congestion in suburban corridors could be drawbacks. Ultimately, anyone who values a dynamic, educated community with a lower cost of living than coastal peers—and who can tolerate humidity and suburban sprawl—will find Raleigh a compelling place to call home.
Crime in Raleigh, NC
Higher crime rates than 61% of comparable U.S. locations.
Violent CrimeViolent Crime Analysis
Property CrimeProperty Crime Analysis
Crime Analysis
Raleigh, North Carolina, presents a mixed safety profile for prospective residents. The city's overall crime rates are notably higher than the national average, with violent crime at 391.4 incidents per 100,000 residents and property crime at 2,296.4 per 100,000. These figures place Raleigh in a category where caution is warranted, particularly given the influence of progressive judicial policies in the region that can affect public safety outcomes.
Crime in context
When compared to state and national benchmarks, Raleigh's crime statistics are concerning. The violent crime rate of 391.4 per 100,000 is roughly 12% higher than the national average of approximately 350 per 100,000. Property crime at 2,296.4 per 100,000 is about 30% above the national average of roughly 1,760 per 100,000. These numbers reflect a broader trend in large metro areas, where liberal prosecutorial policies—including reduced sentencing and diversion programs—can lead to higher recidivism and more offenders on the street. Wake County's district attorney has implemented progressive reforms, which critics argue prioritize offender rehabilitation over victim protection and public safety.
What residents experience
Daily life in Raleigh involves navigating a city where property crime is the most common threat. Residents frequently report vehicle break-ins, package thefts, and residential burglaries, particularly in neighborhoods near downtown and major transit corridors. Violent crime, while less common, includes aggravated assaults and robberies that often cluster in specific areas. The presence of progressive judges and district attorneys in the region means that many offenders receive lenient sentences or alternative programs, directly contributing to a revolving-door justice system that undermines deterrence. This ideological approach, while sympathetic to offenders, negatively impacts justice for victims and the public by keeping dangerous individuals in the community.
Neighborhood-level variation is significant. Areas like North Raleigh and parts of Cary (a nearby suburb) generally report lower crime rates, while downtown, Southeast Raleigh, and corridors along Capital Boulevard and New Bern Avenue see elevated incidents. Prospective residents should research specific neighborhoods and consider that even safer areas are affected by spillover crime from higher-crime zones. The city's overall safety is compromised by a judicial environment that often fails to hold offenders accountable, making vigilance and proactive security measures essential for anyone moving to Raleigh.
* Values derived from national, state, county, city and local statistics and may differ in a specific area. Last updated: 2026-04-21T16:48:35.000Z
Narrative content on this page is AI-generated and may contain mistakes. Verify any details that matter before acting on them.
ReloMaps may earn a commission from affiliate links at no extra cost to you.